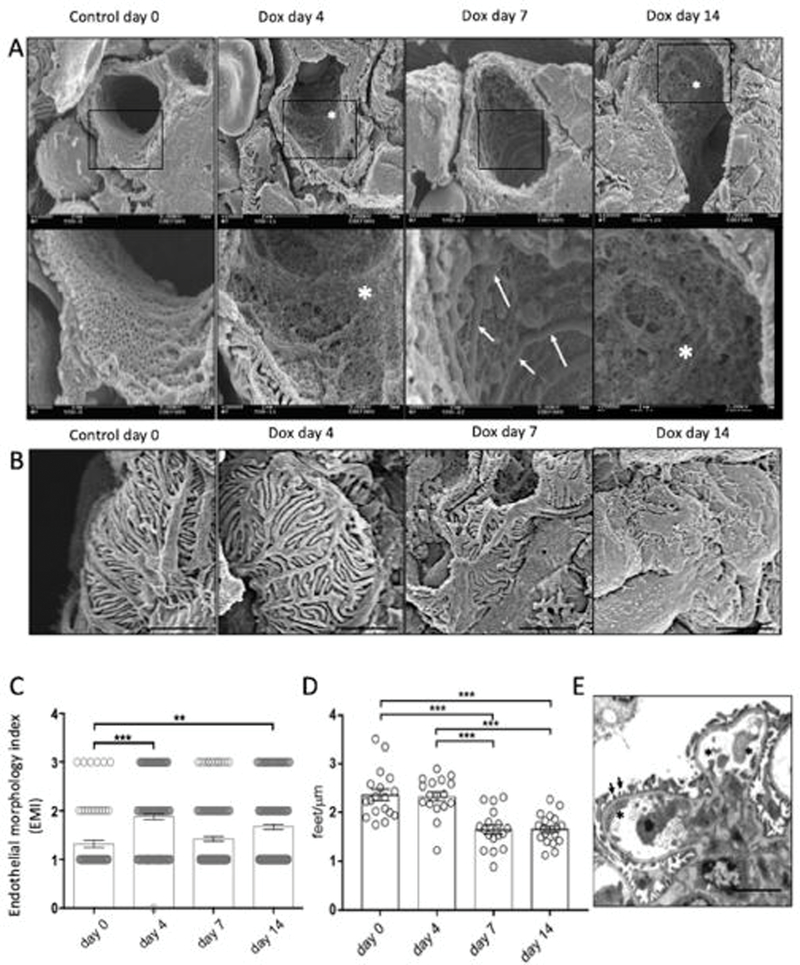
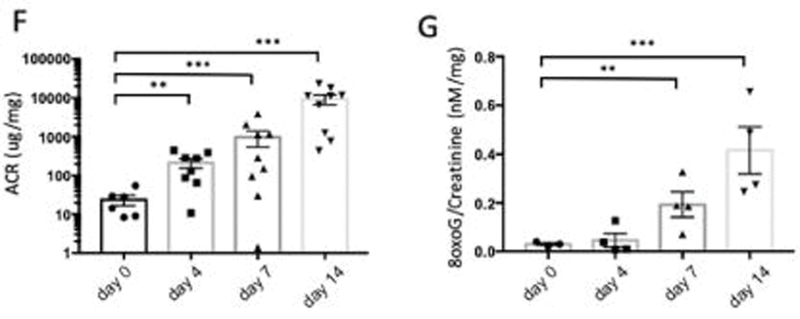
Figure 1. Tgfbr1 signaling activation in podocytes induces ultrastructural changes in endocapillaries preceding ultrastructural changes in podocyte.

(A) Glomerular capillary structure of PodTgfbr1 mice was examined by scanning electron microscopy (SEM) in untreated controls and after Tgfbr1 signaling activation in podocytes with DOX at day 4, 7, and 14. Representative images of capillary vessels at magnification ×10000 upper panel, ×30000 lower panel (white arrows show endothelial ridges, white asterix depict endothelial with not fenestrations). (B) Representative images of podocytes from glomeruli in (A). (C) A semiquantitative endothelial morphology index (EMI) at ×10000 magnification was applied: 0 = normal fenestrations, no visible irregularities; 1 = partly disrupted endothelial cell pattern and fenestrations 10–30% of area; 2 = endothelial cells containing few visible fenestrations, 30–70% of area; 3 = no fenestrations present and irregular protrusions. Mean ± SEM of at least 125 capillary vessels of glomeruli from 5 mice per group. (D) The number of podocyte foot processes per length (PFP/μm) of PodTgfb1 ±DOX at different times (n = 700 PFP counted per group, 3 mice per group. Mean ± SEM PFP/μm/capillary). (E) TEM of glomeruli at 4d DOX (black arrows show normally arranged PFP, black asterix depict endothelial cell protrusions). Functional data from PodTgfbr1; (F) ACR and (G) Urinary 8-oxoG excretion of day 0 controls, day 4–14 of DOX (+/− SEM n=4–9 mice/time point). Error bars represent SEM and * P<0.05, ** P<0.01, *** P<0.001.

