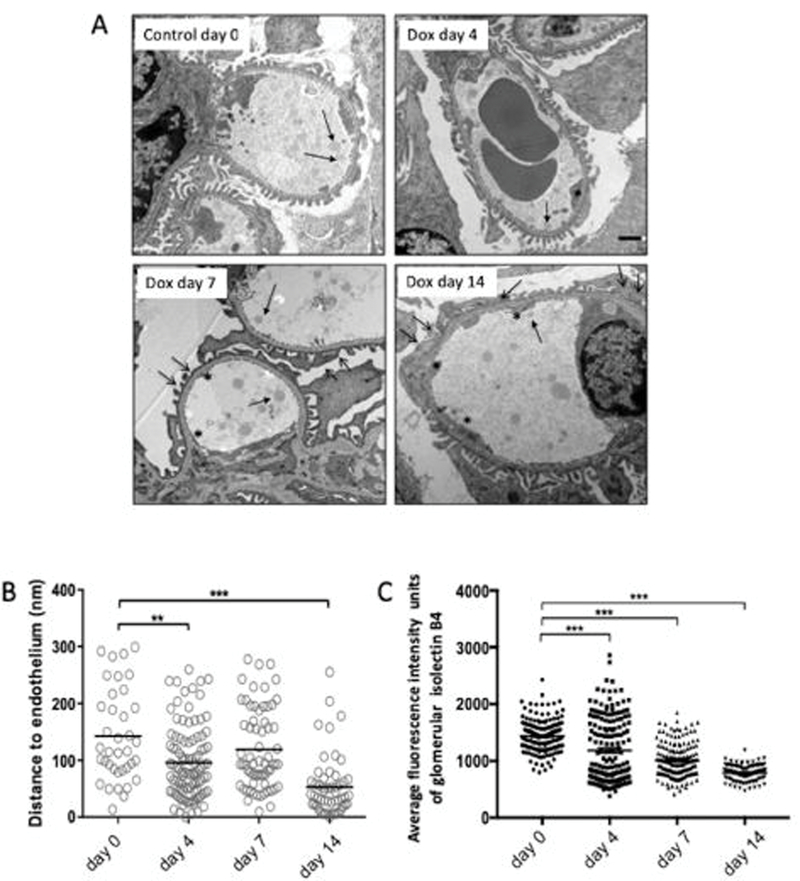
Figure 3. Tgfbr1 signaling in podocytes results in loss of the endothelial surface layer (ESL).
Glomerular ESL of PodTgfbr1 controls and after 4–14 days of DOX was determined by measuring the distance of perfused intralipid droplets and endothelial cells surface by electron microscopy (5–6 mice per time point). (A) Representative TEM images controls and after 4–14 days of DOX. Solid arrows show the lipid droplets, open arrows show podocyte foot process effacement and flattening, and asterix * depict abnormal non-fenestrated GEC area. (B) Quantification of the measured distance between perfused intralipid droplets and endothelial cells surface in nm, at different time points (day 0–14 DOX) (C) Isolectin B4 fluorescent positive glomerular staining intensity of GECs from controls and after 4–14 days of DOX. ** P<0.01, *** P<0.001

