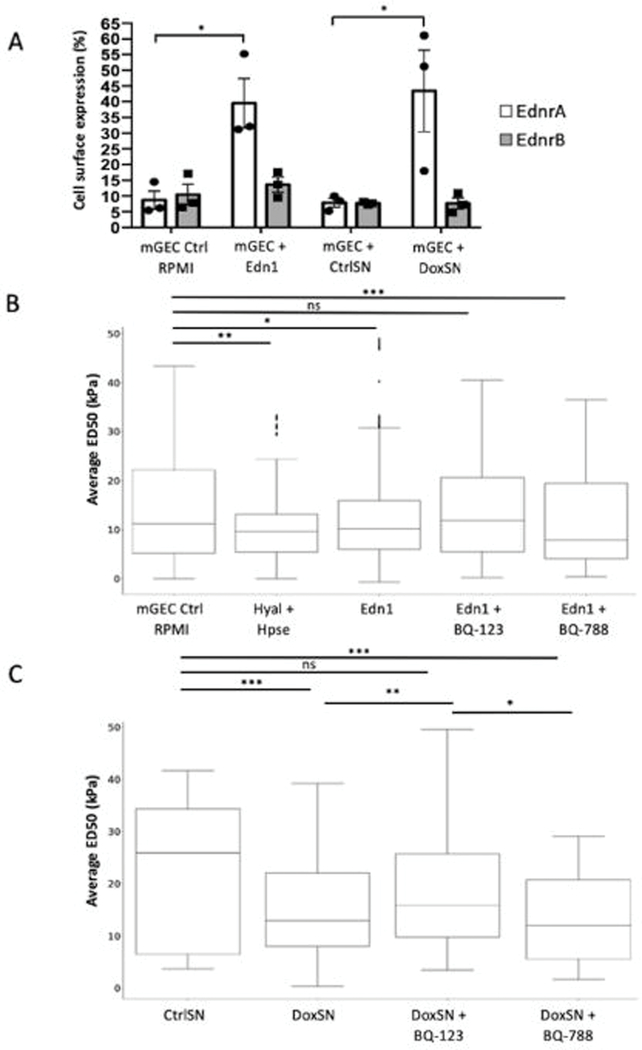
Figure 5. Podocyte derived endothelin-1 in DoxSN reduced ESL of mGECs via Ednra.
(A) Percentage (%) of positive cell surface expression of EdnrA and EndrB of mGEC controls in RPMI or treated with Edn1 (200ng), or treated with control supernatant collected from untreated PodTgfbr1 podocytes (CtrlSN) or from DOX treated PodTgfbr1 podocytes (DoxSN) for 48hr of 3 independent experiments. (B) ESL measured by atomic force microscopy (AFM). Pre-contact interaction of the AFM probe with ESL influences shallow post-contact segment of the force-depth response curve as ESL is fully compressed (see Supplementary Figure S5). In short, a denser ESL corresponds to a greater ED50 (see methods for ED50 metric details). The average ED50 values of mGECs in RPMI controls (n=1317), or 2hr treatment with hyaluronidase and Heparinase III (Hyal+Hpse) as positive control (n=550, P=0.0011), or treated 48hr with Edn1 (n=934), Edn1+BQ-123 1ng/ml (n=624), Edn1+BQ-788 (15ng/ml; n=397). (C) Average ED50 of mGECs treated 48hr with PodTgfbr1 podocytes control supernatant (CtrlSN), DOX treated supernatant (DoxSN; n=1088), DoxSN+BQ-123 (n=480) or DoxSN vs. DoxSN+BQ-788 (n=448). n represents number of indentations per group. * P<0.05, ** P<0.01, *** P<0.001.

