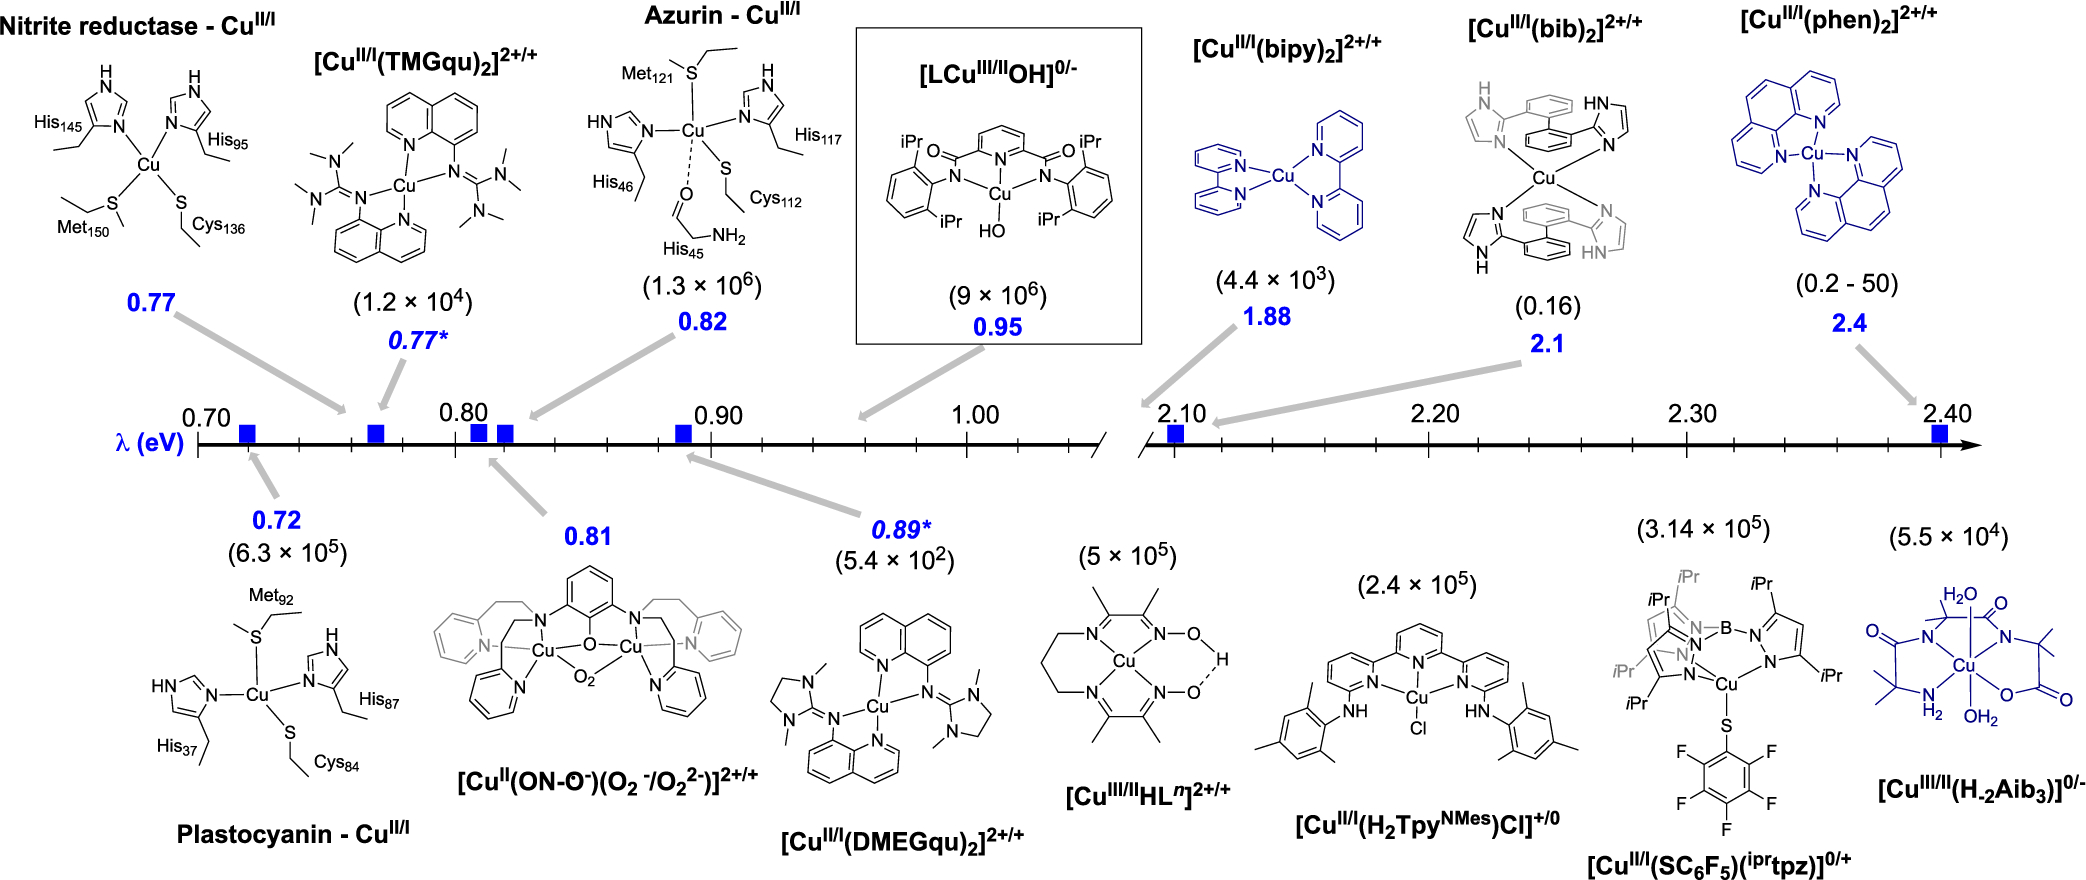
Figure 4.

Schematic representation of electron-transfer self-exchange properties of copper centers in proteins and model complexes (all experimentally determined, except those italicized with asterisks36,37). Reorganization energies (eV) are given in blue, and self-exchange rate constants (M−1 s−1, at 25 °C) are given in parentheses. Complexes in black are coordination number invariant during redox-cycling; complexes in navy change coordination number. Complexes are depicted in their reduced forms.
