
Fig 5. Behaviour assignments of Que (I) and Gerlinde (II) in relation to GPS clusters (A) and speed (B).
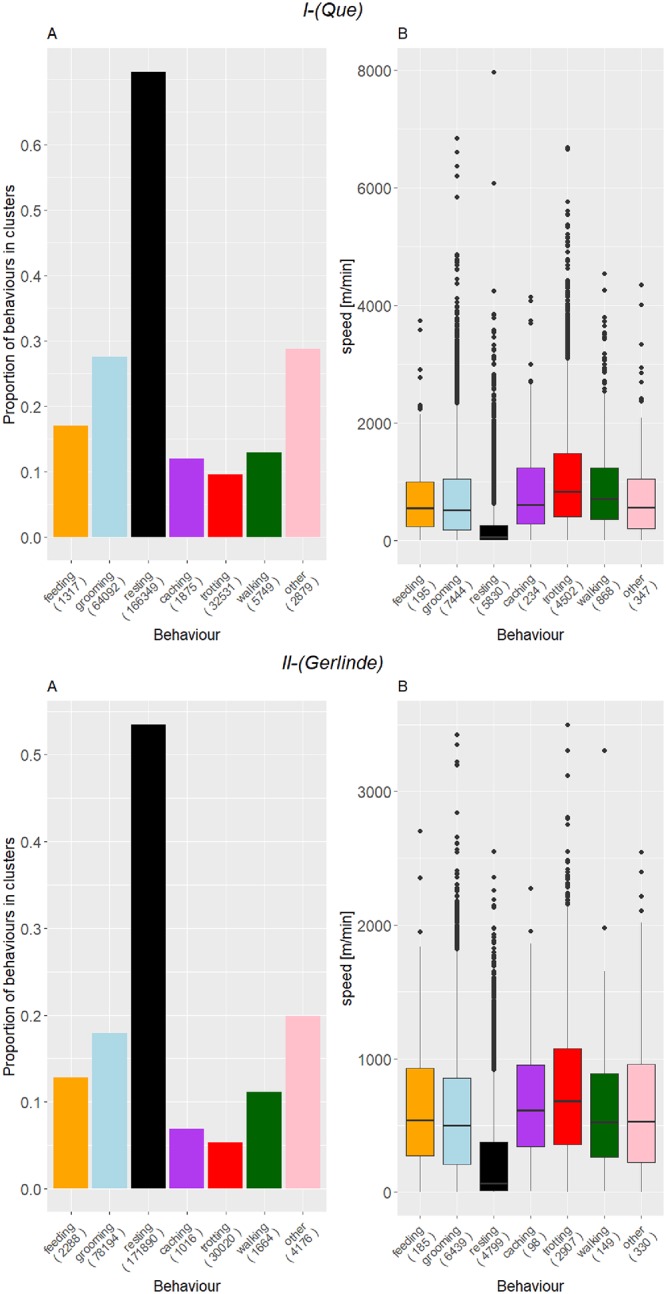
The numbers in the brackets indicate the sample size of each behaviour class. (I) Resting shows the highest association with GPS clusters (71%) and trotting the lowest (9%). Resting events are associated with significantly lower speed than trotting events (Wilcoxon rank sum test, W = 3024826, p < 0.001). (II) Resting shows the highest association with GPS clusters (53%) and trotting the lowest (5%). Resting events are associated with significantly lower speed than trotting events (Wilcoxon rank sum test, W = 2286090, p < 0.001).