. 2020 May 5;9:e54257. doi: 10.7554/eLife.54257

Figure 1. Induction of Il4 and Ccl2 in laser-exposed retinas and choroids of mice.

(a) Induction kinetics of the mRNAs of IL-4, IL-4Rα, CCR2, and CD11b. The induction of Ccl2 peaked at 1 day after the exposure followed by the peak induction of Il4 and Il4ra. (n = 4–14 eyes/group). (b) Kinetics of IL-4-expressing cells by immunohistochemical analyses. IL-4 expressing cells (yellow) accumulated along the margin of laser treated area at 3 days and then move inwards. The IL-4-expressing cells (yellow) were mainly CD11b positive (green) in laser treated areas at 3 days. (c) Localization of CCL2 expression in retinal tissue by immunohistochemistry. CCL2 induction is observed at 1 day after treatment, and CCL2-positive cells (red) are colocalized with the iba1-positive microglial cells (green). The nuclei were stained by TO-PRO-3 iodide (blue). Scale 10 μm. *p<0.05, **p<0.01. ANOVA with post hoc test and linear mixed-effects regression analysis.

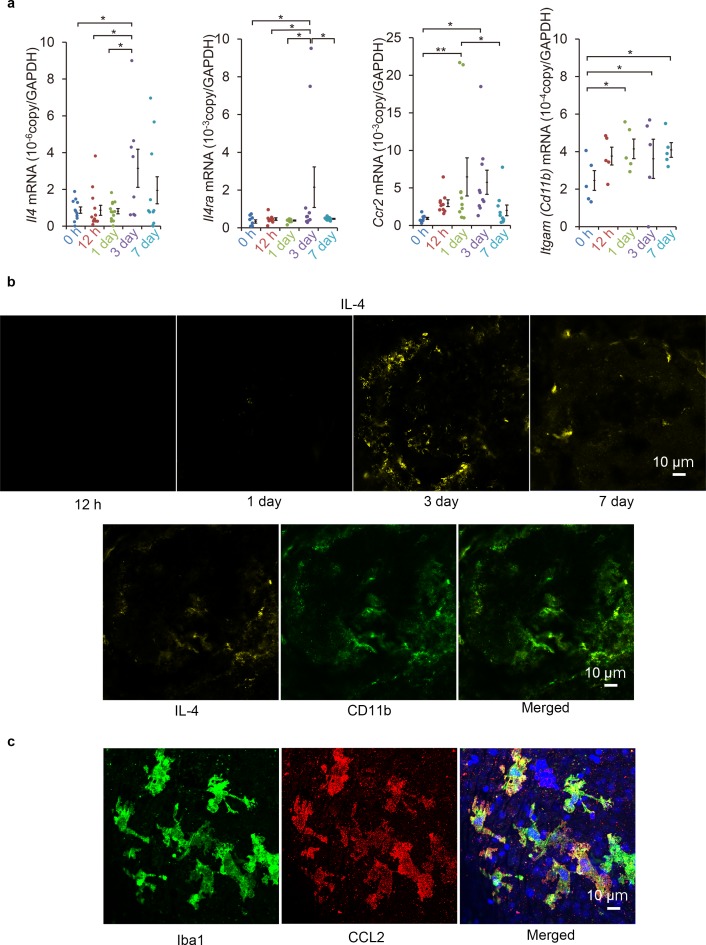
Figure 1—source data 1. Induction kinetics of the mRNAs of IL-4, IL-4Rα, CCR2, and CD11b.

Figure 1.

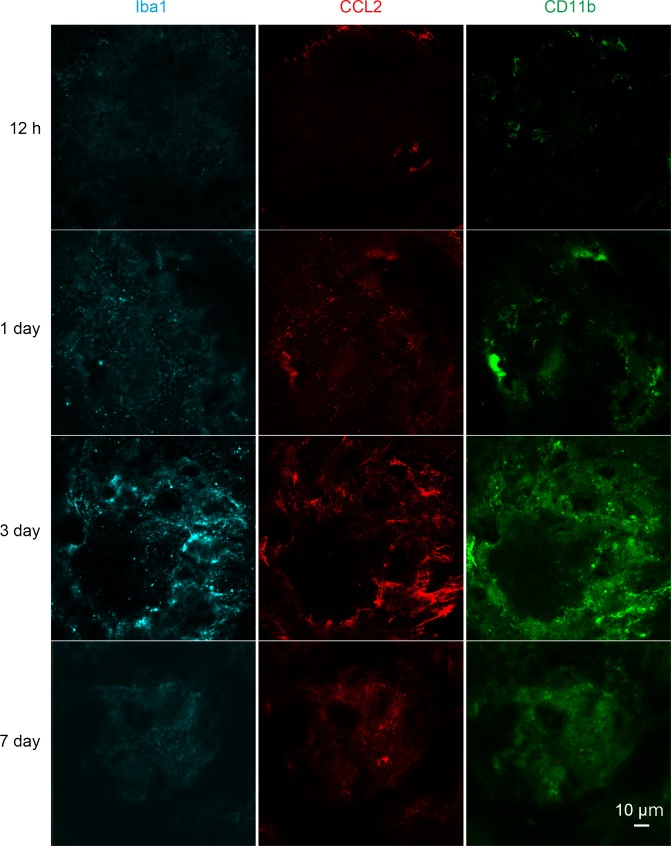
Figure 1—figure supplement 1. Kinetics of IL-4-expressing cells by immunohistochemical analyses in retinal flat mount.

Figure 1—figure supplement 1.

Iba1 (cyan), CCL2 (red) and CD11b (green) expressing cells accumulated in the laser treated area at 1 to 3 days. The CCL2 and CD11b expression peaked at 1 to 3 days and decreased gradually thereafter. Scale 10 μm.
Figure 1—video 1. Localization of bone marrow-derived cells and microglial cells in the retinal tissue of GFP bone marrow chimeric mouse in 3D rendering at 3 days after laser irradiation.
Download video file (904.2KB, mp4)
Bone marrow-derived cells (green) are located in the subretinal layer around the laser irradiation lesion 3 days after laser irradiation. Bone marrow-derived cells (green) expressing CD11b (cyan) were spatially and morphologically distinct from the accumulated microglial cells (arrows). CD11b (cyan) positive microglial cells migrated on CD31 (red) positive retinal and choroidal vessels and are observed on the surface of the choroidal neovascularization. Scale 50 μm.