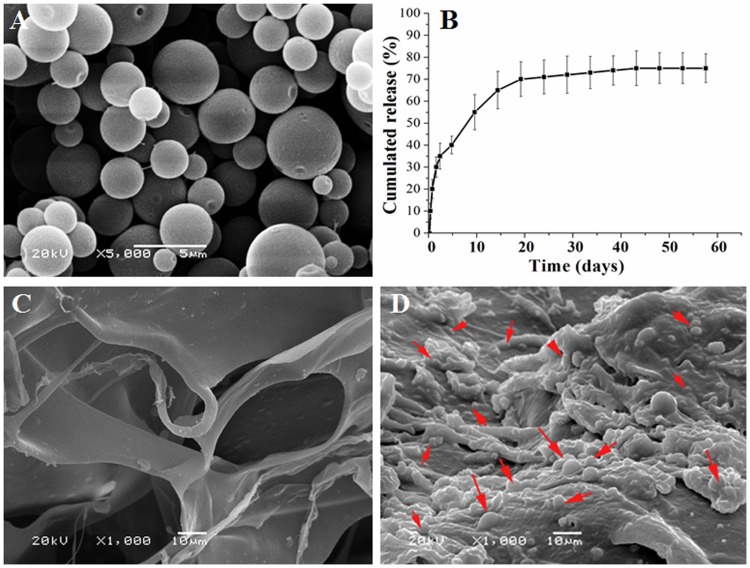
Figure 2.
Characterization of microspheres, cumulative release of ICA and distribution. (A) Scanning electron microscopy images of the ICA loaded chitosan microspheres. (B) The curve of ICA released from the microspheres. (C) and (D) The scaffolds scanning electron microscopy images of the core scaffold, (C) without the chitosan microspheres, (D) with the chitosan microspheres. The results are presented as the mean ± standard deviations (n = 3). Red arrow: chitosan microspheres.

