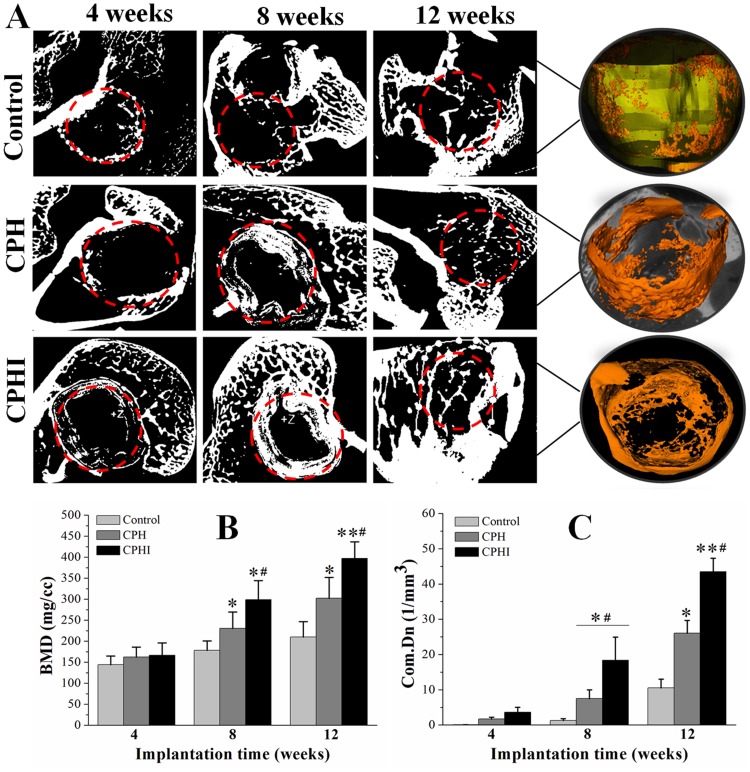
Figure 5.
Micro-CT analysis of new bone. (A) Micro-CT scan images showing the level of regenerated bone tissue after 4–12 weeks. (B) Bone mineral density (BMD) of the regenerated bone tissue after 4–12 weeks. (C) Tissue connective density (Conn.Dn) of the regenerated bone tissue after 4–12 weeks. Data display the mean relative values calculated from three independent experiments (mean ± SD). * p < 0.05; ** p < 0.01; * is the significance compared to defect control, #is the significance compared to 8 weeks. Red dotted circles: defect areas.

