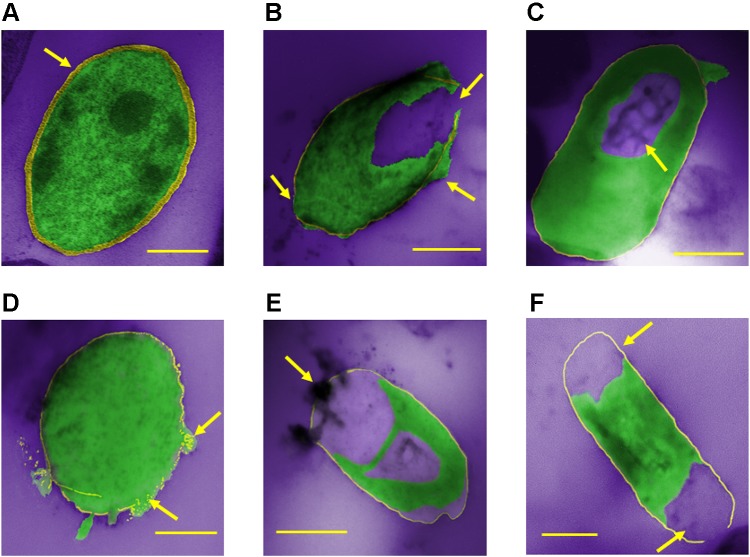
Figure 5.
Colored representative TEM micrographs of damaged E. coli bacteria upon treating with exfoliated BP nanosheets for 3 hours. (Green, cell medium; yellow, bacterial cell wall; violet, background empty region.) (A) Internal cell structure of untreated E. coli bacterium – control sample (scale bar is 200 nm). An arrow indicates the intactness of the bacterial cell wall with the cytoplasm. (B) Ruptured cell membrane and the event of cytoplasmic leakage from the cell membrane (scale bar is 500 nm). The arrows show the events of the cytoplasmic leakage and the disruption of the bacterial cell wall. (C) Central large electron-light area indicating accumulation of DNA molecules confirming disturbed cellular metabolism (scale bar is 400 nm). An arrow indicates the electron-light region in the center of the bacterial cell. (D) Reduced density of phospholipids upon interacting with BP nanosheets (scale bar is 200 nm). The arrows indicate the disintegrated phospholipid layer. (E) The event of BP nanosheets interacting with cell membrane and detached cytoplasm from the cell membrane (scale bar is 500 nm). An arrow indicates the BP nanosheets attached to the bacterium. (F) Ruptured cell wall and separation of cytoplasm from the cell wall (scale bar is 500 nm). The arrows indicate the regions of the lost cellular integrity.

