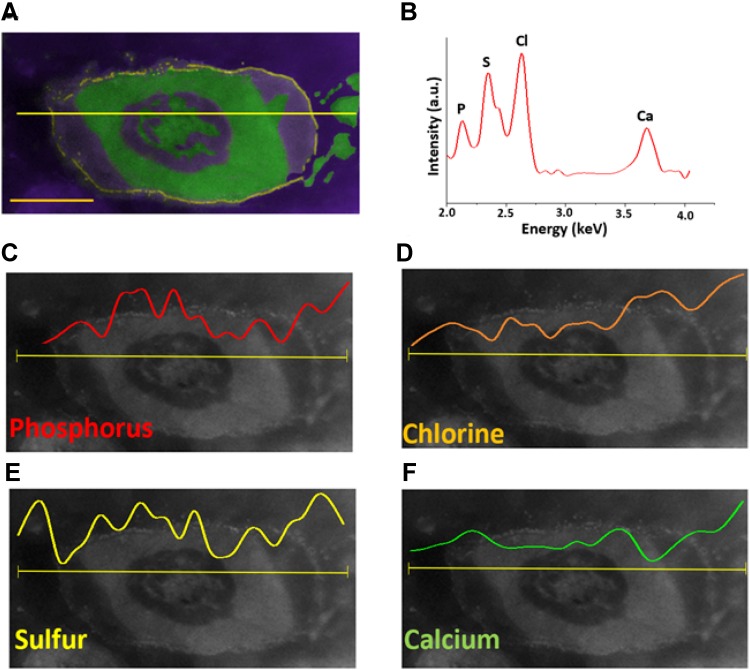
Figure 6.
HAADF-STEM images and EDS elemental line mapping of damaged E. coli bacterium upon treating with BP nanosheets for 3 hours. (A) Colored representative HAADF-STEM image of damaged E. coli bacterium. Green, cell medium; yellow, bacterial cell wall; violet, background empty region (scale bar is 500 nm). (B) EDS spectrum of damaged E. coli bacterium confirming the presence of phosphorus (P), sulfur (S), chlorine (Cl) and calcium (Ca) elements. (C) EDS elemental line map indicating the concentration of P across the damaged E. coli bacterium. (D) EDS elemental line map indicating the concentration of Cl across the damaged E. coli bacterium. (E) EDS elemental line map indicating the concentration of S across the damaged E. coli bacterium. (F) EDS elemental line map indicating the concentration of Ca across the damaged E. coli bacterium. (The horizontal yellow line across bacterium represents elemental line scan region.)

