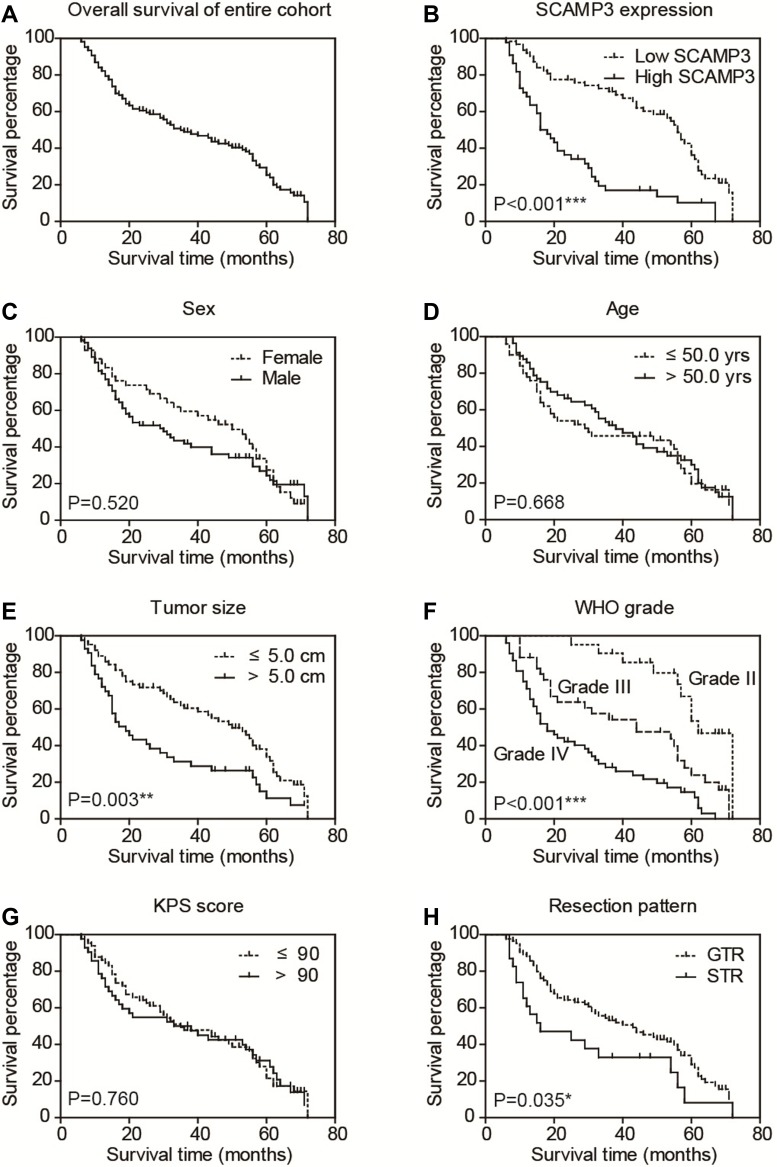
Figure 2.
Overall survival of glioma patients. The overall survival curve of our entire cohort was plotted by Kaplan–Meier analysis (A). Besides, the prognostic effect of each variable was assessed by Log-rank test, including SCAMP3 level (B), patients’ sex (C), age (D), tumor size (E), WHO grade (F), KPS score (G) and resection pattern (H), respectively. *P<0.05 by Log-rank test, **P<0.01 by Log-rank test, ***P<0.001 by Log-rank test.

