
Figure 2.
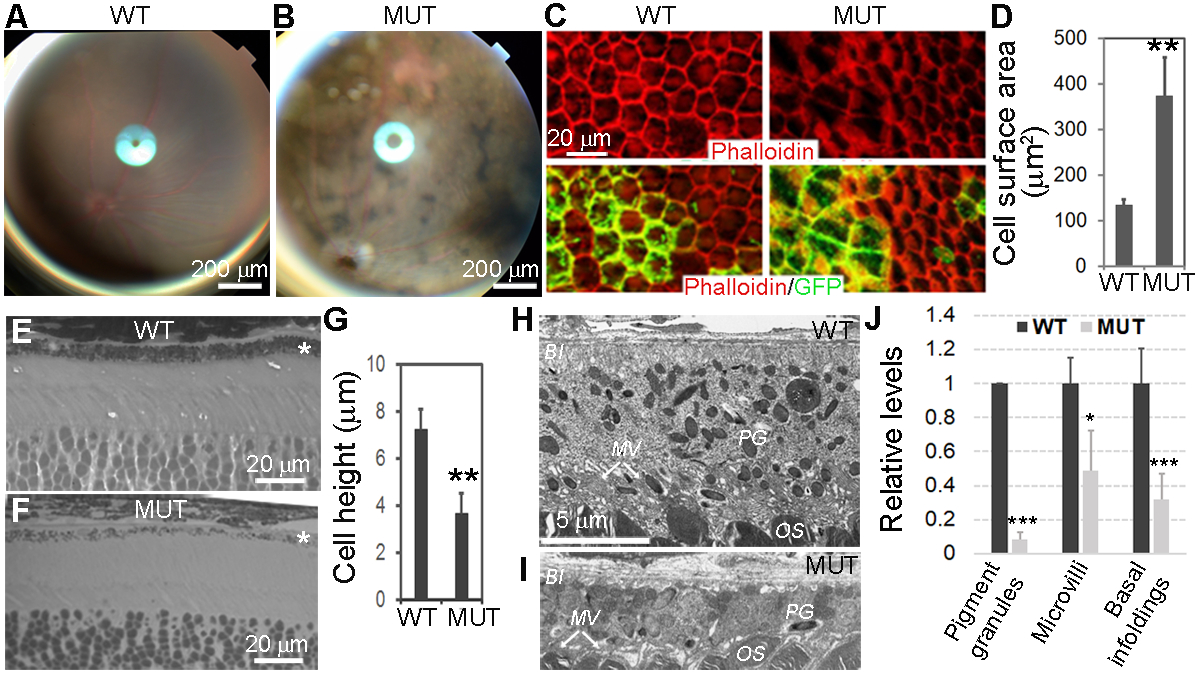
Morphologic changes of Yap1−/− RPE cells. Yap1 cKO mice (Best1-Cre+/GFP+/Yap1fl/fl, MUT) and control mice (Best1-Cre+/GFP+, WT) were analyzed at 5–8 weeks of age. A,B, Fundoscopy of WT (A) and mutant (B) mice, showing uneven mosaic-pattern pigmentation color in mutant. C, Phalloidin (red) and GFP (green) show loss of cuboidal appearance and abnormal cell shape with disrupted F-actin network in the RPE sheets from mutant mice (right panel) compared with WT control mice (left panel). D, The quantitation shows significantly increased cell surface area of Yap1 mutant RPE cells (green cells in the right panel of C). Value = mean ± SD. n = 3 mice for each group. At least 50 cells were counted per animal. E,F, Methylene blue staining of semi-thin retina sections reveals thinner Yap1 mutant RPE cells. *RPE layer G) The quantitation shows significantly reduced cell height of Yap1 mutant RPE cells. Value = mean ± SD. n = 3 mice for each group. At least 10 cells were counted per animal. H-I, Electron microscopy shows normal RPE from WT mice (H) and flattened mutant RPE cells with thinner cell shape and loss of pigment granule (PG), microvilli (MV), and basal infoldings (BI) from the mutant mice (I). OS, photoreceptor outer segment. Images in (H) and (I) are at the same magnification. J, Quantification of pigment granules, microvilli, and basal infoldings in the WT and mutant RPE cells. Number of granules, and area of microvilli and basal infoldings in EM images were quantified by Image J software, then, their relative levels were normalized to RPE cell body area. Their relative comparison between WT and mutant RPE were graphed. Value = mean ± SD. n = 3 mice for each group. At least six cells were counted per animal. *, **, *** are P < .05, P < .01, P < .005, respectively. Bar sizes are indicated on the figures.