Figure 5.

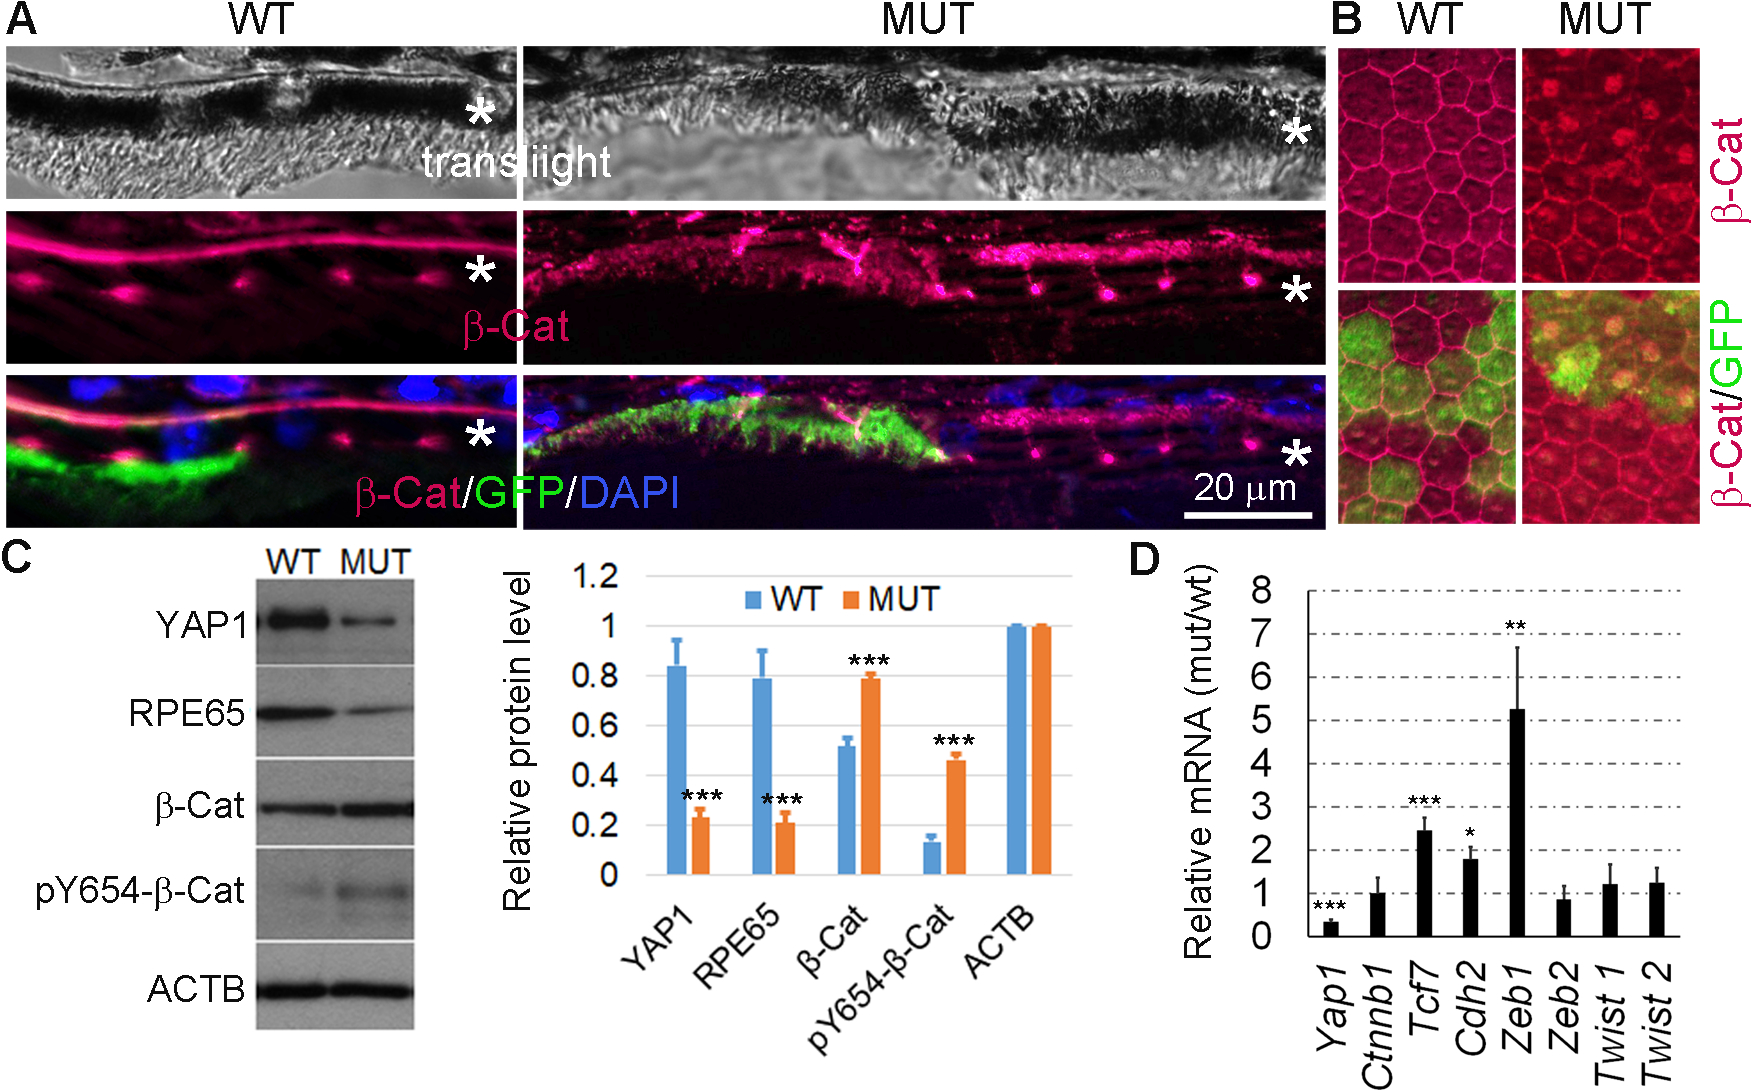
Increased β-catenin activation in the Yap1 KO RPE cells. Yap1 cKO mice (Best1-Cre+/GFP+/Yap1fl/fl, MUT) and the control mice (Best1-Cre+/GFP+, WT) were analyzed at 5–8 weeks of age. A, Immunostaining for β-catenin (red) and GFP (green) on the eye tissue section from WT and mutant mice. *RPE layer. n = 3 mice per group for each assay. Bar size = 20 μm. B, Immunostaining for β-catenin (red) and GFP (green) on the RPE whole mount from WT and mutant mice. C, Western blot analysis was performed with protein samples from the RPE sheets collected from WT and mutant mice. The quantification results from Western blot analysis using ImageJ software are shown on the right side, Value = mean ± SD, n = 3 samples per group. Each sample was extracted from pooled RPE sheets of 5 mice. ***P < .005. D, qPCR analysis from the RPE sheets of WT and mutant showed that the β-catenin nuclear target Tcf7 and EMT markers, Cdh2 and Zeb1 are significant increased. Data expressed as mean ± SD, n = 3 samples per group. Each sample were extracted from pooled RPE sheets of 5 mice. *, **, *** are P < .05, P < .01, P < .005.
