
Figure 3. Risk of adverse outcomes among Penn Heart Failure Study participants with HFpEF stratified by tertiles of APOM.
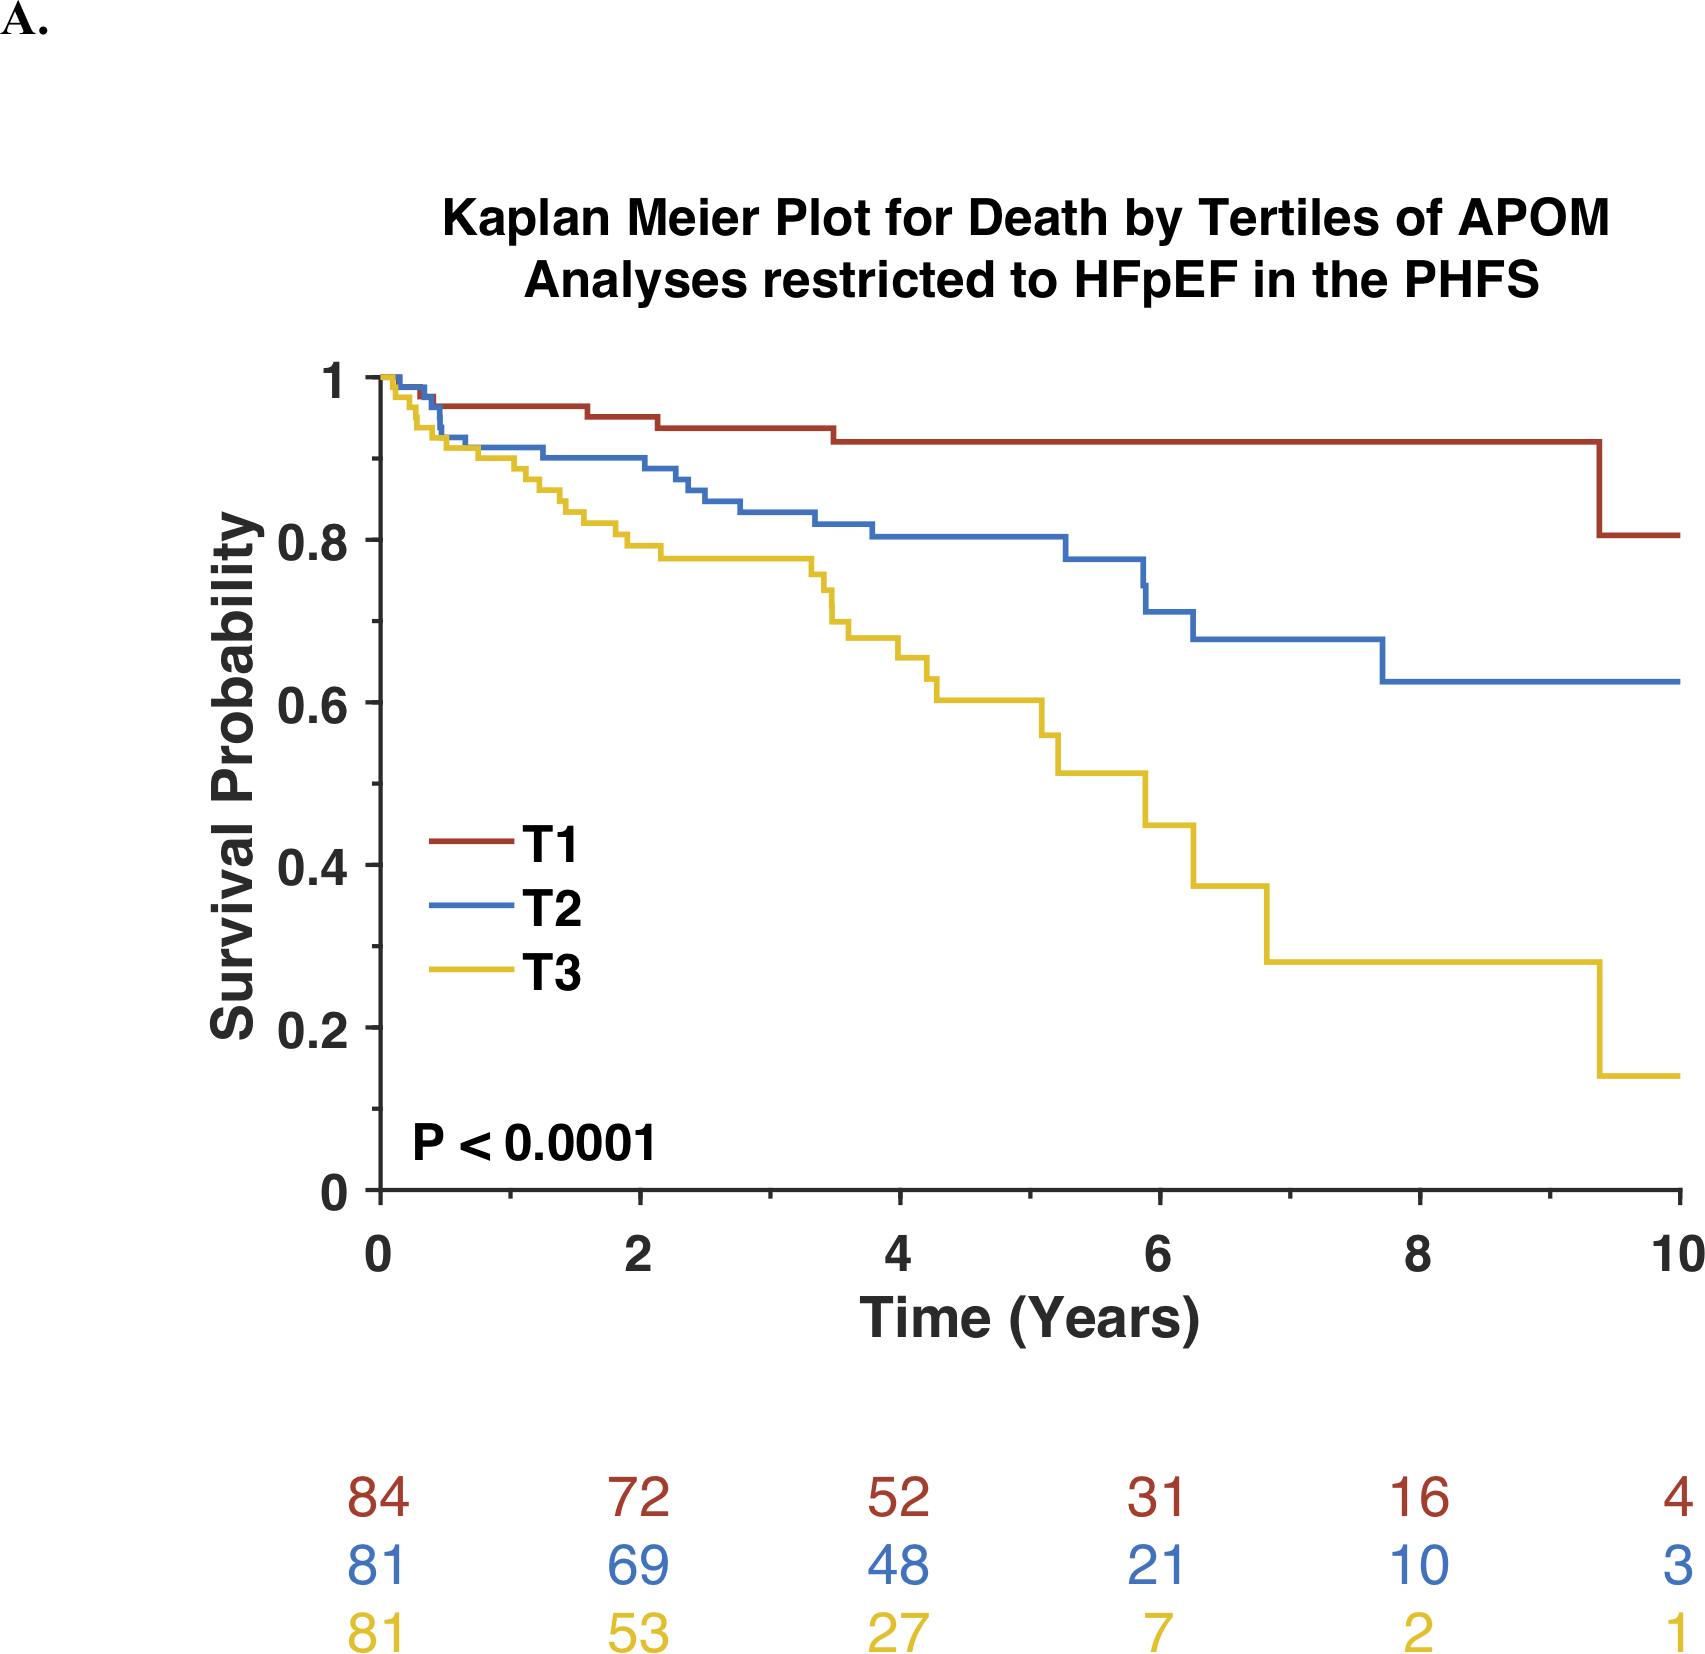
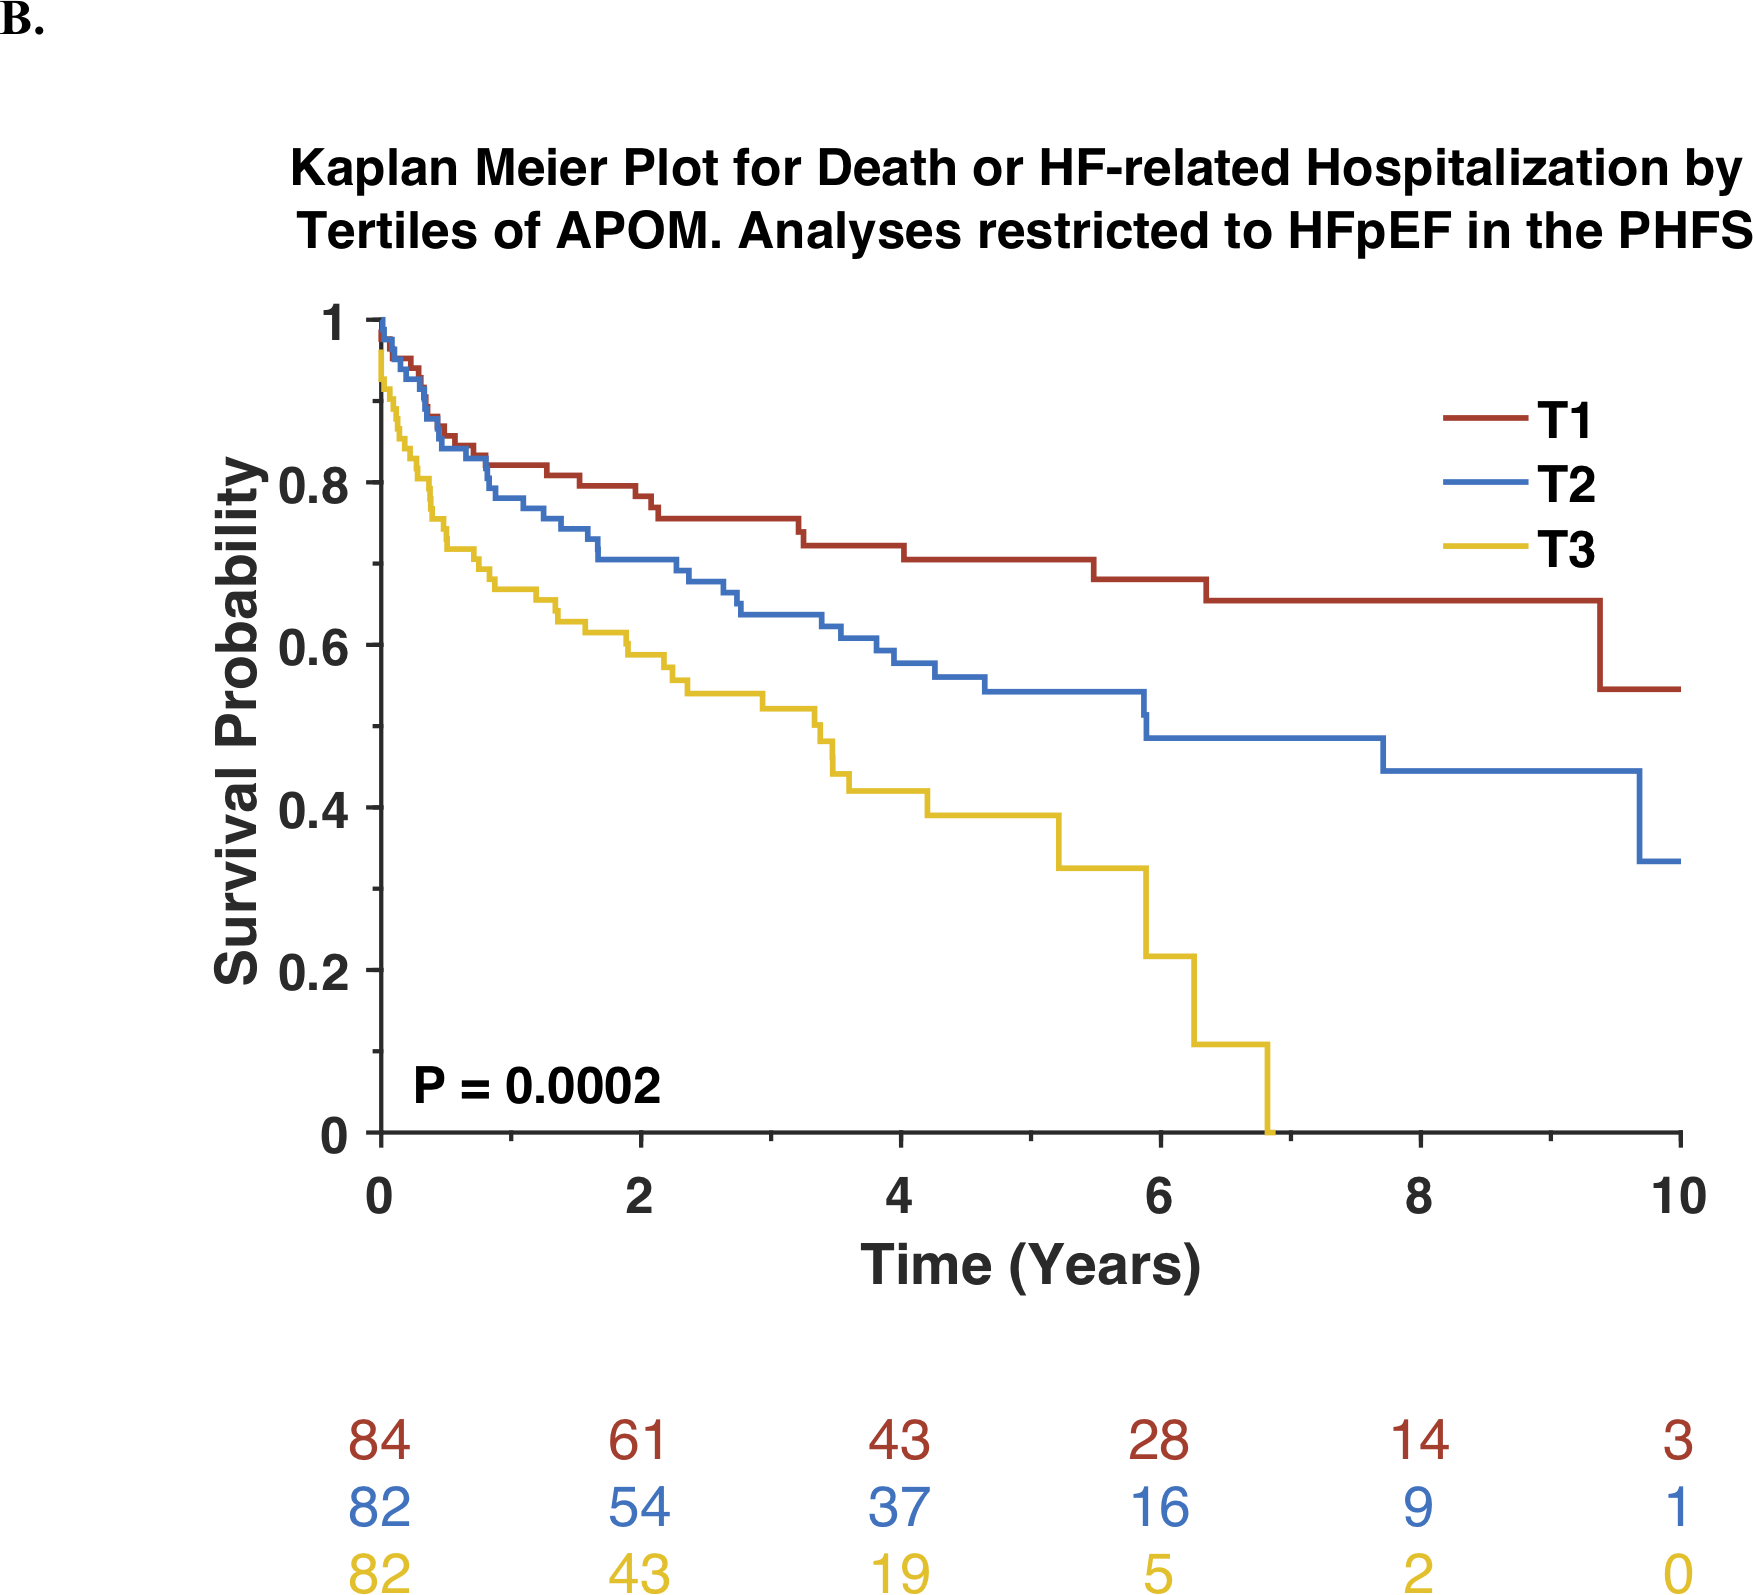
Kaplan-Meier survival curves for all-cause mortality (A) or the composite outcome of death or heart failure-related hospitalization (B) are shown. The number of patients at risk at each timepoint is presented below the graph.