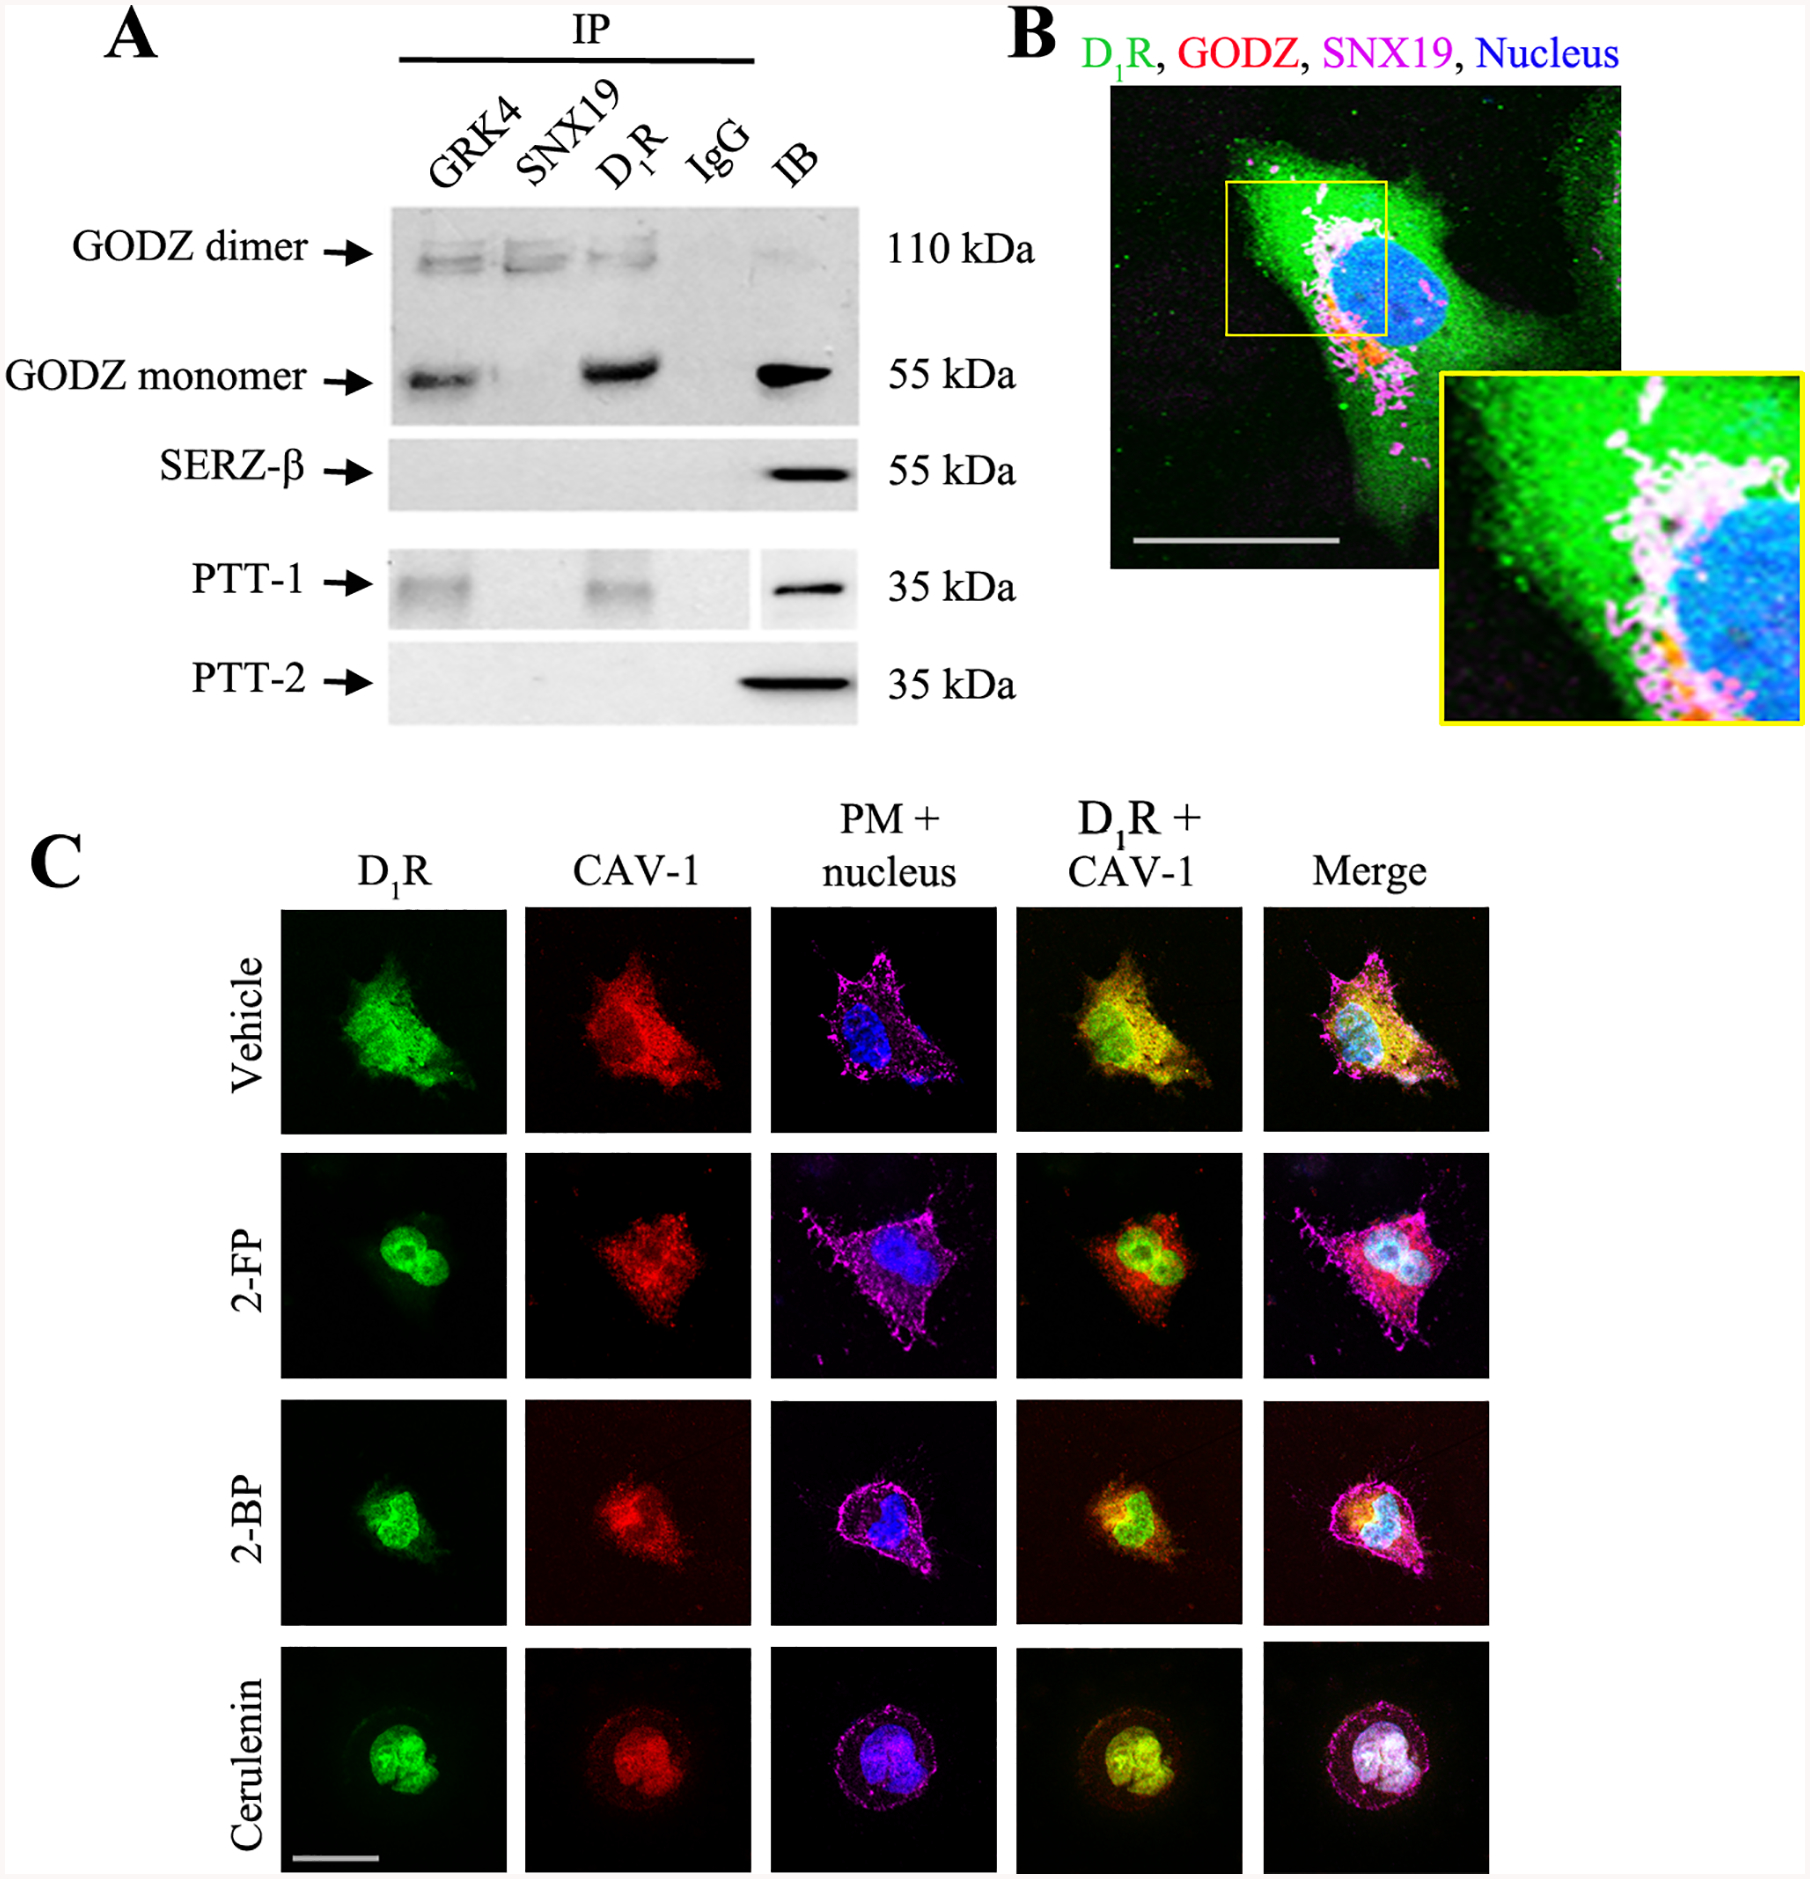
Figure 2. Interaction of endogenous D1R, SNX19, GRK4, GODZ, and caveolin-1 (CAV-1).

A. Co-immunoprecipitation (IP) of D1R, SNX19, and GRK4 with GODZ and palmitoyl-protein thioesterase 1 (PPT-1) and PPT-2 at the basal state. Normal rabbit IgG was used as negative control and regular immunoblot (IB) of the cell lysate was used as positive control. Results of 1 of 3 experiments are shown. B: Basal distribution D1R (pseudocolored green), SNX19 (pseudocolored magenta), and GODZ (pseudocolored red) at the perinuclear area in serum-starved hRPTCs. Colocalization of all three is denoted by the discrete white areas. DAPI was used to visualize the nucleus (pseudocolored blue). 630x magnification, scale bar = 10 μm. C: Serum-starved hRPTCs were pre-treated with palmitoylation inhibitors 2-fluoropalmitate (2-FP), 2-bromopalmitate (2-BP), or cerulenin for 2 hr, or vehicle as control. Basal colocalization of D1R (pseudocolored green) and CAV-1 (pseudocolored red) is indicated by the discrete yellow areas in the D1R + CAV-1 image of vehicle-treated cells. Wheat germ agglutinin and DAPI were used to visualize the plasma membrane and nucleus (pseudocolored magenta and blue), respectively. 630x magnification, scale bar = 20 μm. Representative images are shown from 1 of 3 experiments. About 20–30 cells were scored per treatment.
