
Figure 1.
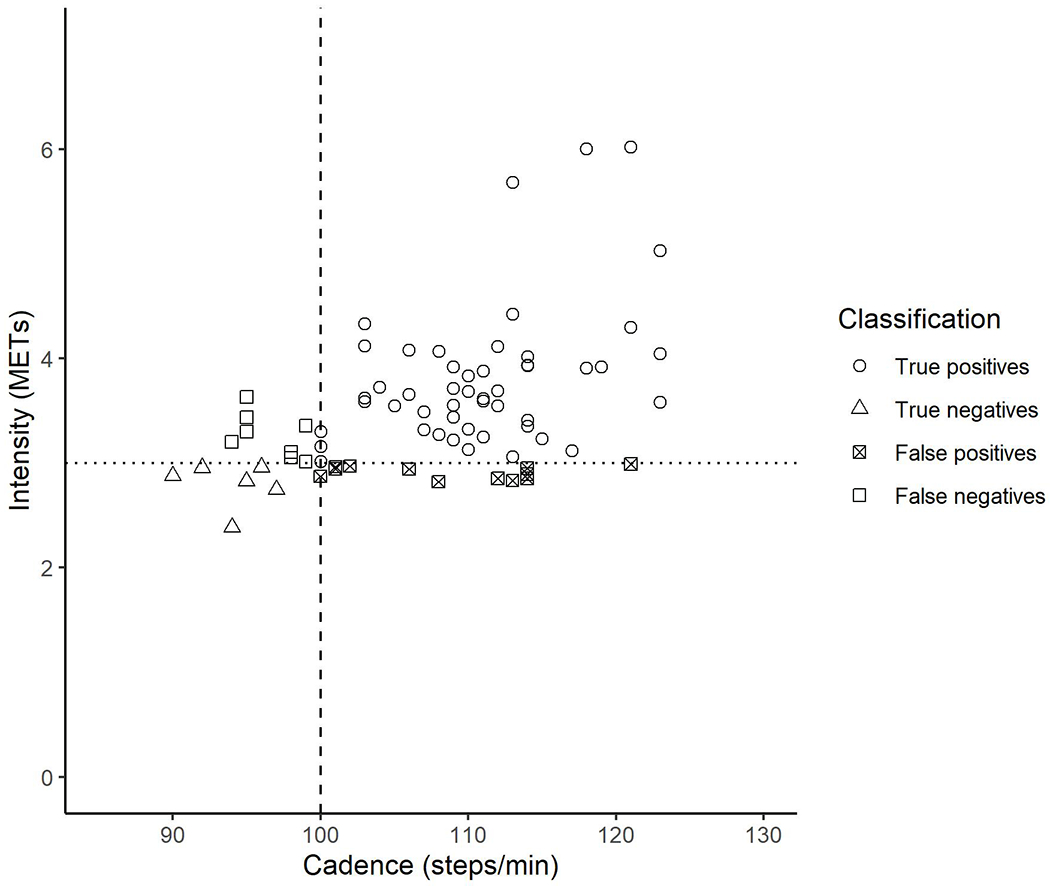
Scatter plot of cadence (steps/min) and intensity (metabolic equivalents [METs]) values observed during overground walking at a self-selected preferred walking pace. The shapes of the data points represent the classification of bouts as true positives (open circles), true negatives (open triangles), false positives (squares with cross), and false negatives (open squares). The dotted line signifies absolutely defined minimally moderate intensity (≥3 METs). The dashed line represents the heuristic moderate-intensity cadence threshold (≥100 steps/min).