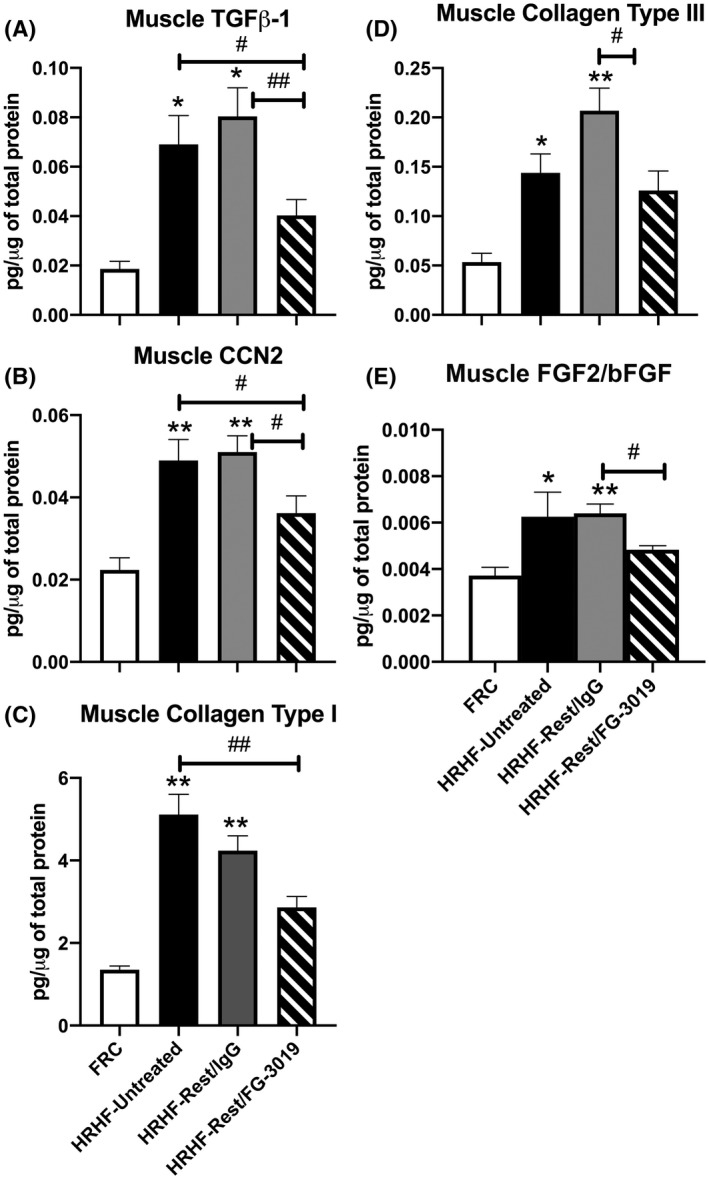
Figure 4.

Flexor digitorum muscle levels of fibrosis‐related proteins, quantified using ELISA. A, Muscle levels of TGFβ1 (transforming growth factor beta 1). B, Muscle levels of CCN2 (cell communication network protein 2, CTGF). C and D, Muscle levels of collagen types I and III. E, Muscle levels of FGF2/bFGF (basic fibroblast growth factor). *P < .05 and **P < .01, compared to FRC rats; # P < .05 and ## P < .01, compared to HRHF‐Untreated or HRHF‐Rest/IgG rats as shown. Number/group: n = 10 FRC, n = 10 HRHF, n = 5 HRHF‐Rest/IgG, and n = 6 HRHF‐Rest/FG‐3019. Mean ± SEM shown
