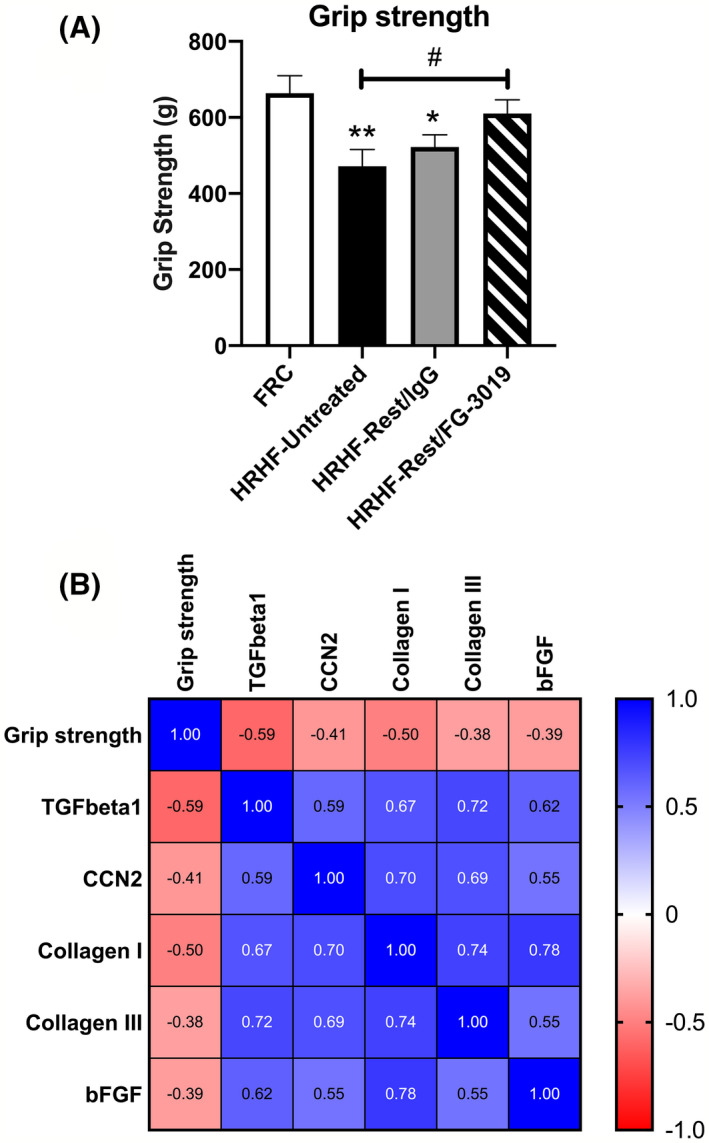
Figure 9.

Forearm grip strength and correlations between grip strength and fibrosis‐related protein levels in flexor digitorum muscles. A, Grip strength in grams in 10 FRC rats at 30 wk after onset of experiments, 10 HRHF‐Untreated rats at 24 wk after onset of experiment (ie, after 6 wk of shaping and weeks of HRHF task performance), and 5 HRHF/Rest‐IgG and 6 HRHF‐Rest/FG‐3019 at 30 wk after onset of experiments (ie, after shaping, task, and then rest plus treatments). *P < .05 and **P < .01, compared to FRC rats; # P < .05, compared to HRHF‐untreated rats. Mean ± SEM shown. B, Correlational matrix showing Pearson correlation coefficient r values for grip strength versus ELISA‐quantified levels of fibrosis‐related proteins (all moderate to strong negative associations, with 0.3‐0.49 interpreted as moderate, and 0.5‐1 interpreted as strong) and between the different fibrosis‐related proteins (all strong positive associations)
