Figure 3:
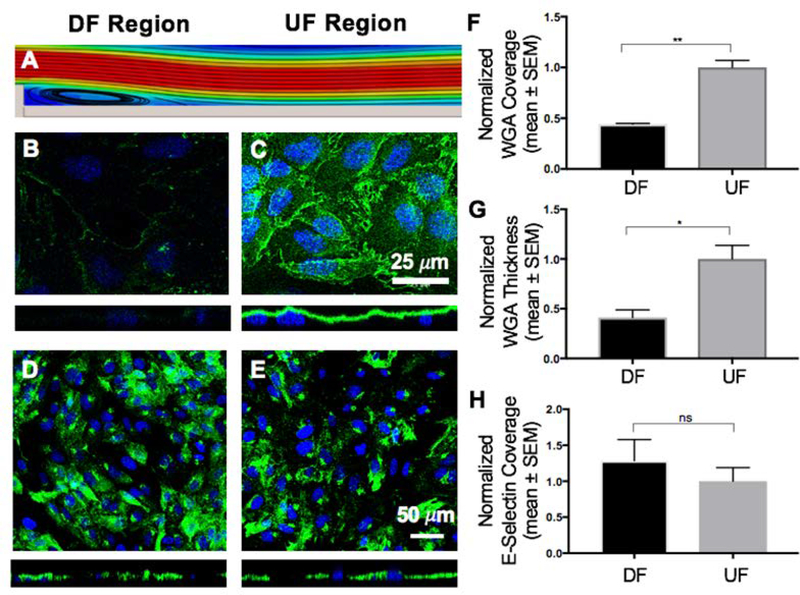
Effect of DF and UF patterns on the GCX and the expression of E-selectin. A. Computer aided simulation of DF formation immediately after the step (refer to Fig. 2A and Fig. S2 for more details). B. The coverage and thickness of GCX is significantly low within the DF region (green is WGA-labeled GCX and blue is DAPI-labeled nuclei). C. In the UF region the GCX is shown to be abundantly expressed both in coverage and thickness. D and E. Expression of the endothelial surface adhesion molecule E-selectin. The introduction of different flow patterns did not affect the coverage of HUVEC by E-selectin. F, G and H. Data quantification for GCX coverage, GCX thickness, and E-selectin coverage, respectively, on the surface of HUVEC. F. GCX coverage in UF region compared to DF region. G. GCX thickness in UF region compared to DF region. H. E-selectin coverage in UF region compared to DF region. All data “Normalized with UF”. Student t test was used to compare DF vs. UF. Sample sizes: WGA-labeled GCX expression N=3, E-selectin expression N=9. Significance is denoted as *P<0.05, **P<0.01, or not significant (ns).

