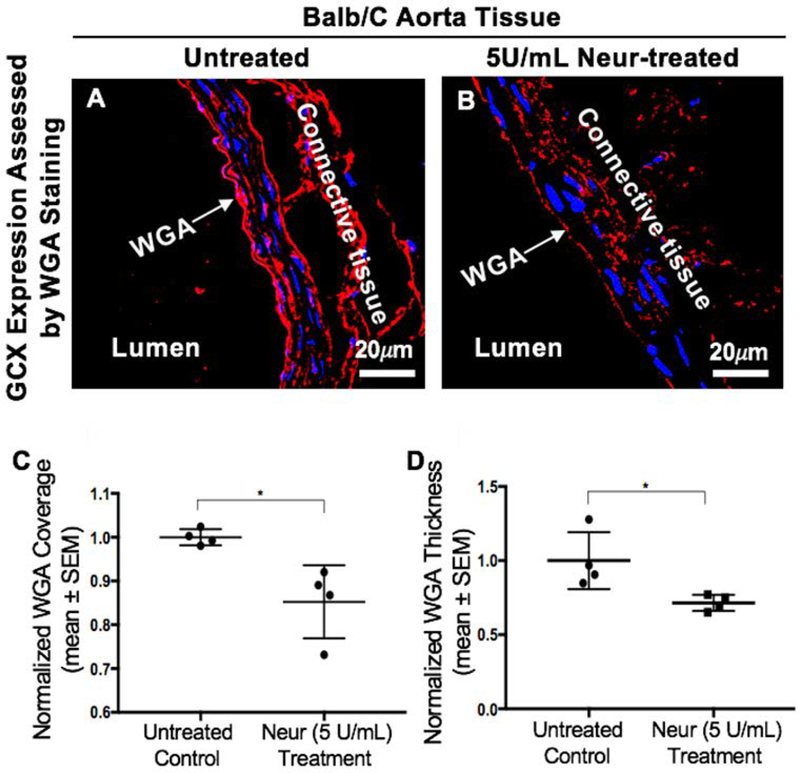
Figure 5:
Expression of GCX in the abdominal aorta of Balb/c mice. A. Control mice showing a uniform layer of GCX within the lumen of the abdominal aorta. B. After treatment of Balb/c mice with 5 U/mL of Neur we observed a decrease in the expression of GCX, with the layer showing discontinuity in coverage across the lumen of the abdominal aorta. C. Data quantification for coverage of GCX. D. Data quantification for the thickness of GCX. The sample size (N) is 4 for WGA-labeled GCX, data was statistically analyzed using the student t-test, and the statistical significance between the two groups is denoted as *P<0.05.

