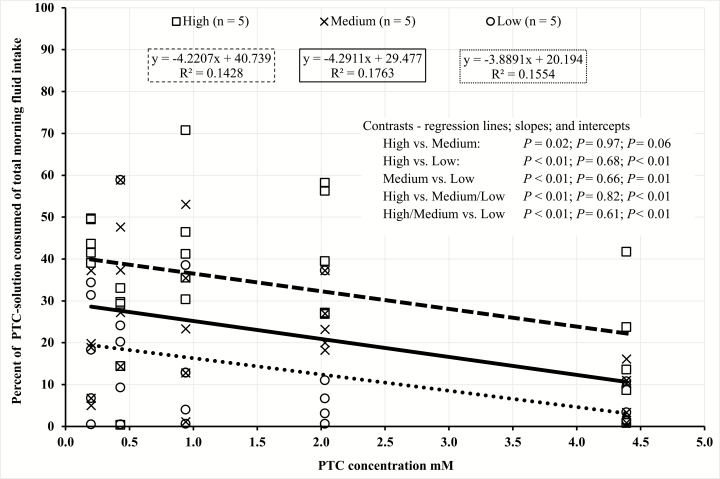
Figure 2.
Trial 2 linear regressions of phenylthiocarbamide (PTC) consumption by total PTC intake categories (high: □ − − −; medium: × ——; low: ○ ∙ ∙ ∙ ∙) for Rambouillet and Targhee rams administered five PTC concentrations (0.20, 0.43, 0.94, 2.03, and 4.39 mM) suspended in 3.0 kg of water. Paired contrast made between high vs. low, medium vs. low, and low vs. high. Orthogonal contrast made between high/medium vs. low and high vs. medium/low.

