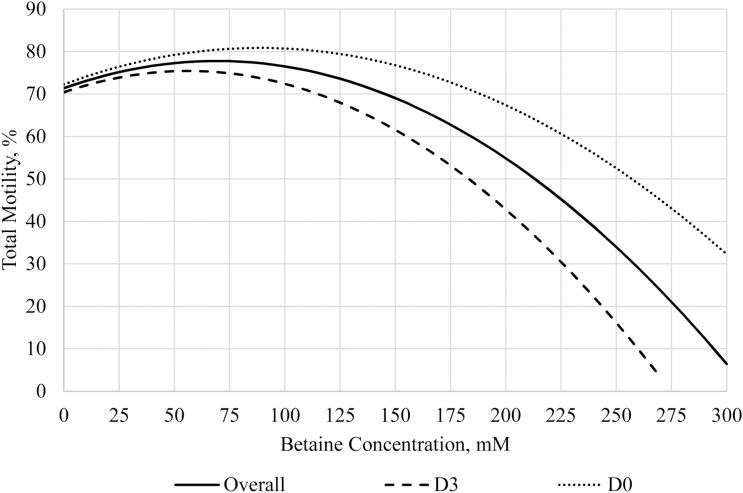
Figure 3.
Regression analyses for total motility in Exp1. Semen was collected from six boars and diluted into four treatment extenders that were supplemented with 0, 51, 102, and 205 mM of betaine and analyzed on day of collection (D0) and after 72 h of storage (D3). The mixed procedure of SAS 9.4 was used to perform the regression analyses, where three regressions were performed: overall total motility, D0 total motility, and D3 total motility. All regressions were quadratic. For the overall total motility regression, the following equation was determined to best fit the data: y = 71.3 + 0.19x – 0.0013x2, where x = mM betaine; R2 = 0.52; maximum total motility = 77.8% when x = 70 mM. For fresh semen (D0), the following equation best fits the data: y = 72.2 + 0.19x – 0.0011x2, where x = mM betaine; R2 = 0.55; maximum total motility = 80.8 when x = 90 mM. For stored semen (D3), the following equation best fits the data: y = 70.4 + 0.18x – 0.0016x2, where x = mM betaine; R2 = 0.71; maximum total motility = 75.4 when x = 55 mM.

