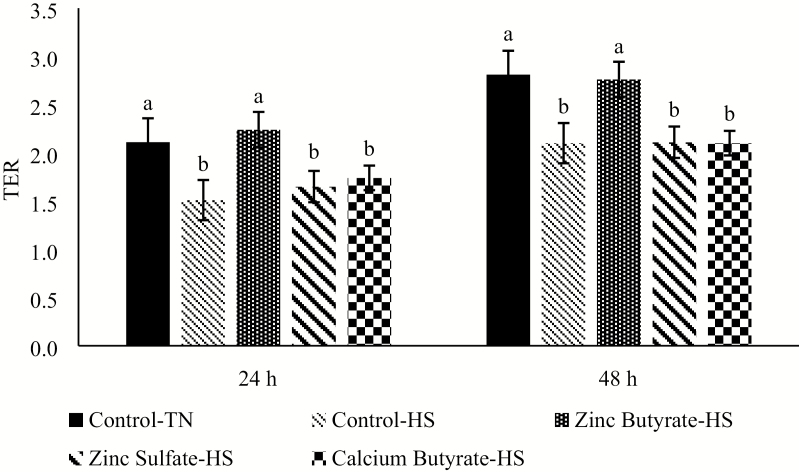
Figure 3.
Effect of HS challenge on transepithelial electrical resistance (TER) of the IPEC-J2 cells under various treatments at 300 µM concentration after being exposed for either 24 or 48h. Values are expressed as a ratio to the control at 0 h. n = 8. Values are expressed as mean ± standard error of the mean. Values with different superscripts are significantly different at P < 0.05; TN = thermoneutral; HS = heat stress.

