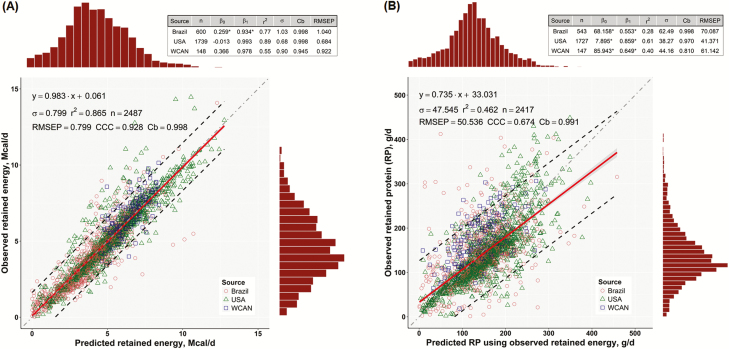
Figure 1.
(A) Relationship between observed and predicted RE (Mcal/d) and (B) relationship between observed and predicted RP (g/d) using observed RE (Mcal/d) for the Brazilian (circles), USA (triangles), and western Canadian (squares) datasets. The solid red lines represent the linear regression of observed on predicted values, the shaded areas represent the 95% confidence interval, and the dashed lines define the 95% prediction interval of all data points. The top- and right-side histograms represent the distribution of the predicted and observed values, respectively. The dashed gray lines represent the y = x, unity line. The adequacy statistics shown at the top grid were computed with the Model Evaluation System [http://www.nutritionmodels.com/mes.html; (Tedeschi, 2006)]. Panels were reproduced from Tedeschi and Fox (2018) with permission.

