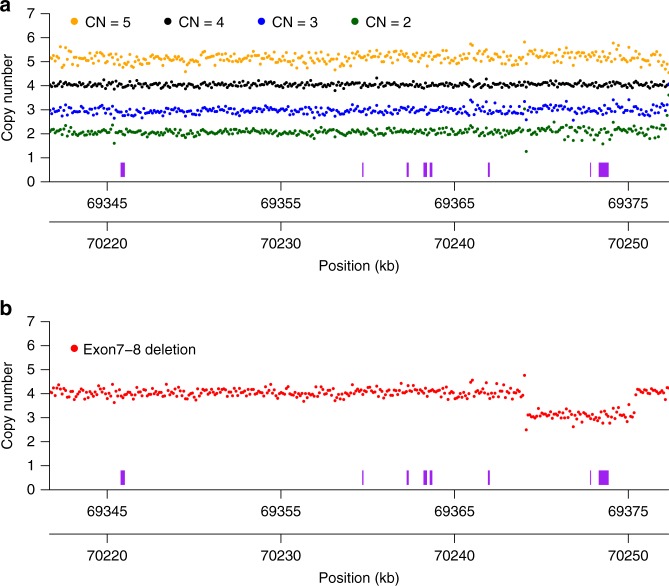
Fig. 1. Common copy-number variants (CNVs) affecting the SMN1/2 loci.
a Depth profiles across the SMN1/SMN2 regions. Samples with a total SMN1 + SMN2 copy number of 2, 3, 4, and 5 (derived from average read depth in the two genes) are shown as green, blue, black, and orange dots, respectively. Depth from 50 samples are summed up for each CN category. Each dot represents normalized depth values in a 100-bp window. Read counts are calculated in each 100-bp window, summing up reads from both SMN1 and SMN2, and normalized to the depth of wild-type samples (CN = 4). The SMN exons are represented as purple boxes. The two x-axes show coordinates (hg19) in SMN1 (bottom) and SMN2 (upper). b Depth profiles aggregated from 50 samples carrying a deletion of exons 7 and 8 are shown as red dots. Read depths are calculated in the same way as in (a).

