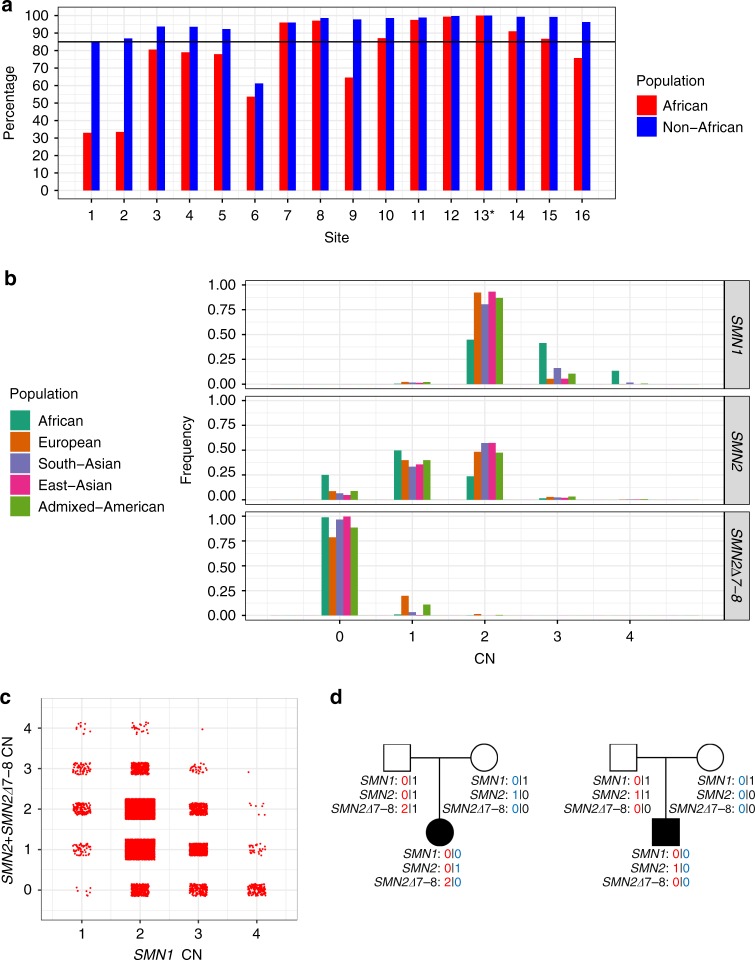
Fig. 3. Distribution of SMN1/SMN2/SMN2∆7–8 copy numbers in the population.
a Percentage of samples showing copy number (CN) call agreement with c.840C>T across 16 SMN1–SMN2 base difference sites in African and non-African populations. Coordinates of these 16 sites are given in Table S1 and site 13* is the c.840C>T splice variant site. The black horizontal line denotes 85% concordance. b Histogram of the distribution of SMN1, SMN2, and SMN2∆7–8 copy numbers across five populations in 1kGP and the National Institute for Health Research (NIHR) BioResource cohort. c SMN1 CN vs. total SMN2 CN (intact SMN2 + SMN2∆7–8). d Two trios with an SMA proband detected by the caller and orthogonally confirmed in the Next Generation Children project cohort. CNs of SMN1, SMN2, and SMN2∆7–8 are phased and labeled for each member of the trios.

