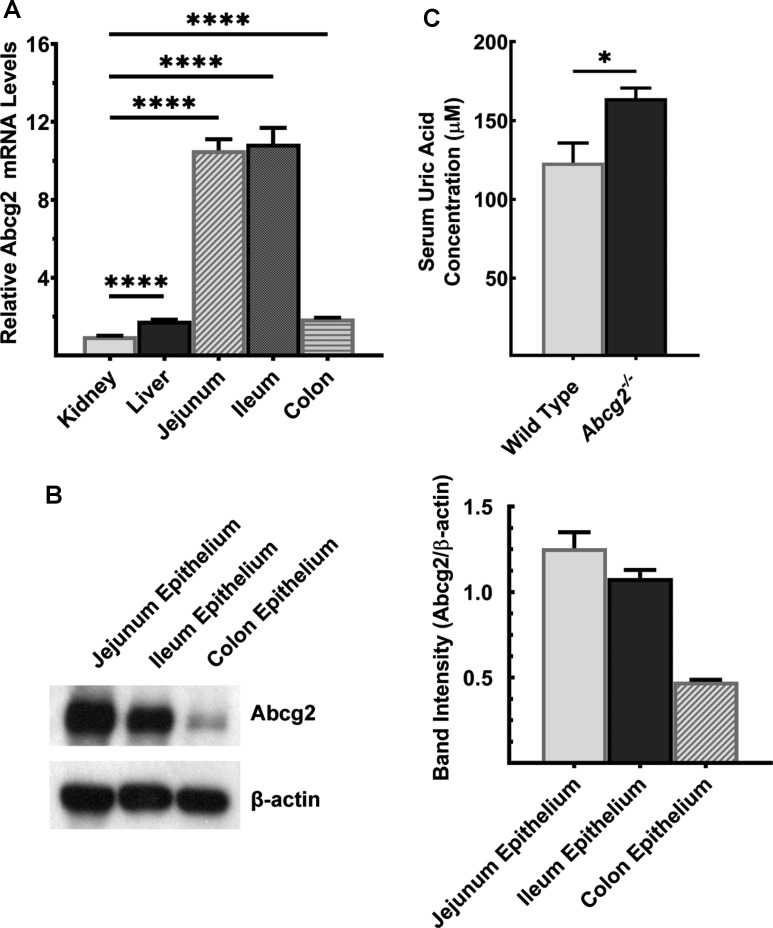
Figure 4. Abcg2 is robustly expressed in mouse intestine.
(A) Quantitative PCR analysis of Abcg2 mRNA in kidney, liver, and intestinal segments of wild-type mouse. Data show mean values ± SEM relative to kidney, which is taken as 1. ****P < 0.0001. (B) Western blot for Abcg2 protein levels in intestinal segments of wild-type mouse. Western blot band intensities were estimated using ImageJ software and the band intensities were normalized to the respective β-actin band intensities. Please see Supplementary Figure S12 for a full blot image. (C) UA was measured in serum of Abcg2−/− mice and wild-type mice. Mice used in the study were 7-months old. Data show mean values of three mice per group ± SEM. *P < 0.05.

