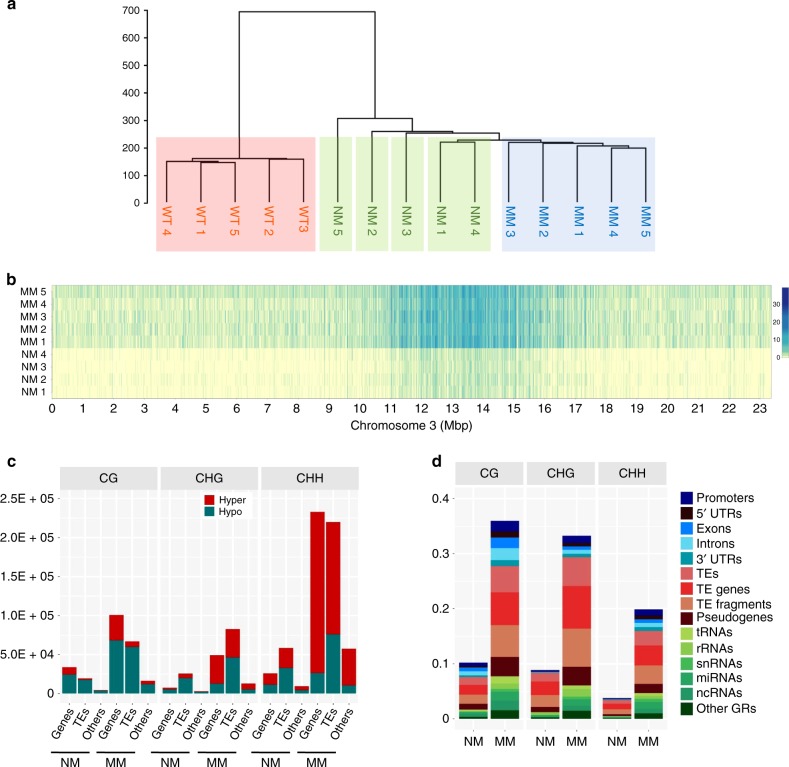
Fig. 4. High-resolution discrimination of memory and nonmemory methylome features.
a Hierarchical clustering of first-generation wild-type, memory, and nonmemory lines. Individuals were represented as vectors of the mean of Hellinger divergences (HD) at DMP positions within 2-kb nonoverlapping genomic regions. The hierarchical clustering was built using Ward agglomeration method. The Hellinger divergence (HD) was computed by using the centroid of five wild-type samples (HD formula is listed in Sanchez et al.18). b Heatmap showing the sum of absolute methylation difference for the direct memory vs. nonmemory comparison. The absolute value of the difference between methylation levels from control centroid (average of four control plants) and each individual (five memory plants, four nonmemory plants) at each differentially methylated cytosine site was used to build the heatmap. Each bin represents sum of methylation level difference in 2 kb. Scale bars represent the sum of absolute methylation level difference for a 2-kb interval. c Total hyper- and hypo-DMP counts in the NM (nonmemory) and MM (msh1 memory) comparison. Each context, CG, CHG, CHH, was assigned to genic regions (coding region plus 1 kb upstream to start codon, 1 kb downstream to stop codon), TE-related regions (including TEs, TE genes, TE fragments and pseudogenes) and others (including tRNAs, rRNAs, snRNAs, miRNAs, ncRNAs). DMPs were defined as hyper if site methylation difference in the comparison of each individual to the control centroid was greater than 0 and defined as hypo if less than 0. d The relative frequency of DMPs in the nonmemory (NM) and memory (MM) comparison. DMPs are assigned to genic region (blue shades), TE-related region (red shades) and others (green shades). The centroid of the nonmemory group was used as a reference. The relative frequency of DMPs in each genomic feature was estimated as the number of DMPs divided by the number of total genomic cytosine positions in each genomic feature. Source data underlying Fig. 4c, d are provided as a Source Data file.

