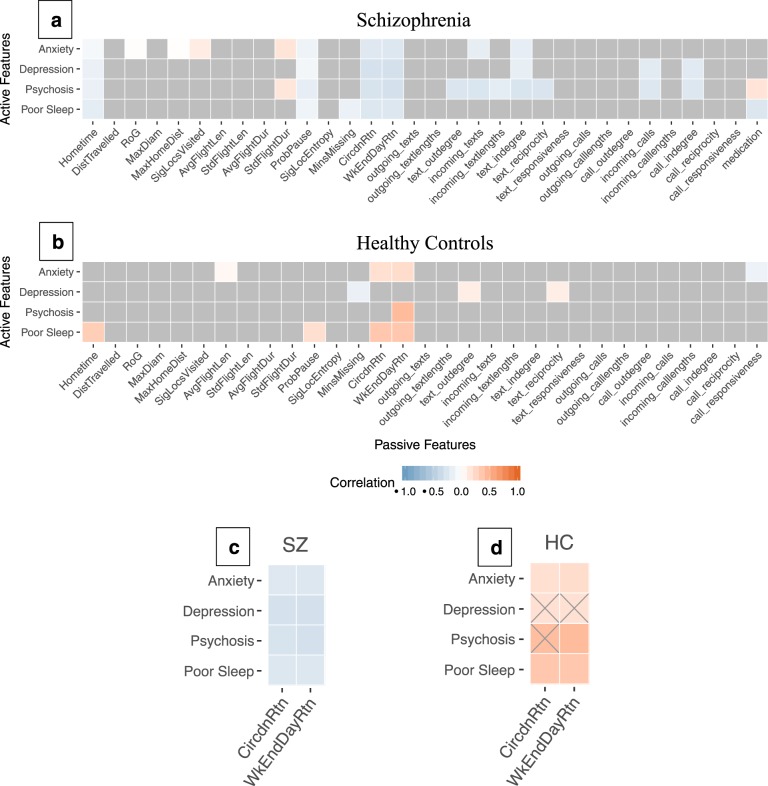
Fig. 3. Correlation Heatmap.
Correlation heatmap of passive (x-axis) and active (y-axis) features averaged from daily calculations for each participant (a, b). Gray squares in (a) and (b) indicate non-significant correlations and are reidentified as gray X’s in (c) and (d) to show underlying correlation trend direction. Passive features are discrete measures of mobility and sociability processed from raw GPS data and call/text logs. Detailed descriptions for each feature have been published by Barnett et al24. A focus on social rhythm features is magnified in (c) and (d).

