Figure 3.

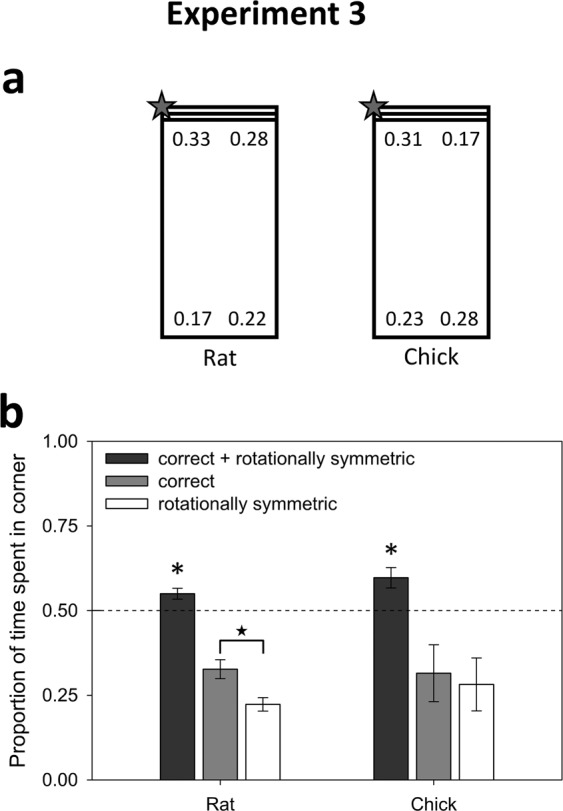
Results of Experiment 3. (a) Corner preferences by rats and chicks, as measured by the proportion of time spent in each corner. The correct corner is denoted with a star. Because the target corner was varied across trials, the data have been rotated prior to averaging and are displayed in this rotated form. (b) The rats use the striped wall to discriminate between the correct corner and the rotationally symmetric corner, while the chicks are only guided by boundary geometry. Asterisks denote significant t-tests of geometry (correct + rotationally symmetric corners) against a 0.5 chance level with p < 0.05. Star denotes the paired t-test between the correct and rotationally symmetric corners, with p = 0.05.
