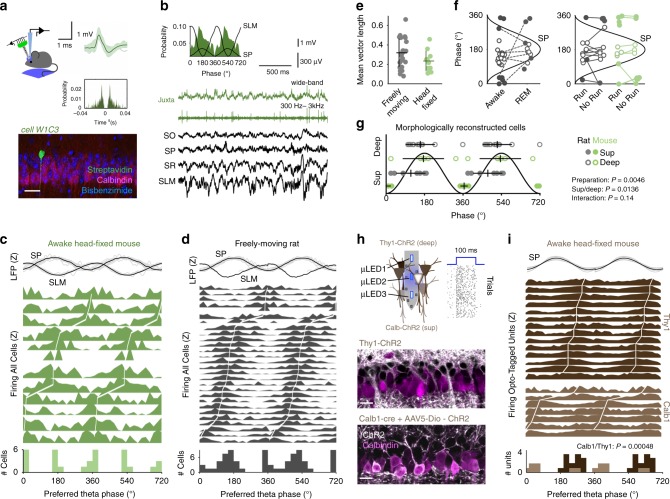
Fig. 1. Bimodal distribution of theta phase-locked firing across CA1 sublayers.
a Representative example of a CA1 pyramidal cell recorded juxtacellularly from a head-fixed running mouse. See average action potential waveform and autocorrelation at right, and morphological identification as deep cell at bottom. Scale bar 50 µm. b Theta phase-locked firing histogram of the cell shown in a. Raw local field potential (LFP) traces and juxtacellular signals are shown below: SO, stratum oriens; SP, stratum pyramidale; SR, stratum radiatum; SLM, stratum lacunosum moleculare. c Theta phase firing histogram from single cells recorded in awake head-fixed mice, ranked according to their preferred phase (n = 12 cells). Individual (gray) and mean (black) theta filtered LFP signals at top are z-scored (Z). The population histogram at bottom represents the distribution of mean preferred phases from individual cells. d Same for single pyramidal cells recorded juxtacellularly in freely moving rats (n = 28 cells). e Individual and mean ± SD values of vector length per cells reported before in head-fixed and freely moving conditions. No differences between groups. f Awake/REM sleep (left) and RUN/no-RUN (running vs. other motor behavior) dependency of theta phase preference of single pyramidal cells. See legend in (g). g Multivariate analysis of morphologically identified cells demonstrate effects per location (Harrison–Kanji test for deep-superficial location: χ2(2) = 10.7, p = 0.0136) and preparation (χ2(2) = 8.5, p = 0.0046); no interaction (χ2(1) = 2.1, p = 0.148). Phase preferred data from each morphologically identified cell is depicted separately for deep and superficial cells in both preparations. h Optogenetic tagging of single units using micro-LED optoelectrodes in two transgenic lines allowed identifying superficial (Calb1-cre + AAV5-DIO-ChR2-YFP) and deep CA1 pyramidal cells (Thy1-ChR2). Raster at right shows response of one representative unit to 79 trials of nanowatt blue light stimulation in a Thy1-ChR2 mouse. Bottom, ChR2 signal (white) and Calbindin immunostaining (magenta) are shown in false colors (one confocal plane from each line). Scale bar 25 µm. i Phase-locked firing histograms from Calbindin+ superficial (n = 7 units from 3 mice) and Thy1+ deep opto-tagged units (n = 14 units from 2 mice; statistically different Watson–Williams test, F(1,20) = 17.7, p = 0.00048. Note that bimodal distribution of preferred theta phases can be explained by different cell-type contribution.

