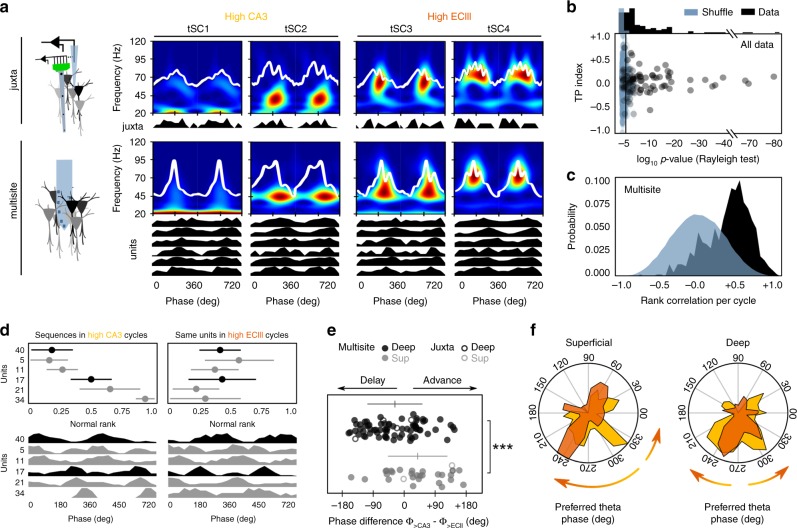
Fig. 5. Dynamic phase shifts of deep and superficial CA1 pyramidal cells.
a Unsupervised classification of theta cycles in different classes allowed evaluating changes of firing dynamics from single-cells recorded juxtacelullarly and using multisite probes. Cycles classified as tSC1 and 2 are associated to larger CA3 inputs (yellow) while tSC3 and 4 reflect larger entorhinal layer III inputs (orange). b Results from the surrogate tests (1000 shuffles) on significant theta modulation of single-cell data during theta cycles subclasses. Only cells/units meeting significance (p < 0.05 Rayleigh test) for both tSC1-2 and tSC3-4 firing histograms were considered for further analysis (n = 7 juxtacellular cells, n = 96 units from multisite recording). c Rank order tests were used to identify sequences of units repeating consistently across classified theta cycles as tested against chance order (500 shuffles). d Example of the effect of high ECIII versus high CA3 inputs in deep and superficial units firing together over several theta cycles. Upper plots show mean rank order ± SD for each unit for all high CA3 (from up to bottom: 19, 13, 17, 17, 18, and 10 cycles) versus high ECIII cycles (from up to bottom: 13, 15, 13, 12, 14, and 13 cycles). Bottom plots show same data plotted as theta phase firing histograms. The order was established by high CA3 cycles. Note significant phase shift of putative superficial units #21 and 34 at bottom and the deep unit #40 at top. e Phase shift differences (high CA3 phase – high ECIII phase) caused by tSC3-4 cycles (>ECIII) vs. tSC1-2 cycles (>CA3) in deep and superficial cells. Data from juxtacellular (4 deep and 3 superficial cells; open dots) and multisite recordings (70 deep and 26 superficial units; filled dots). Horizontal lines indicate mean ± SD from each sublayer (deep: black; superficial: gray). Circular ANOVA, F(1,101) = 14.3, p = 0.0003 for all cells together; F(1,5) = 4.8, p = 0.0795 for juxtacellular cells alone; ***p < 0.001. f Mean population polar plots showing phase shift effects of high ECIII inputs in deep and superficial cells separately. Same data set as in (e). The arrows reflect the main trends reported in (e).

