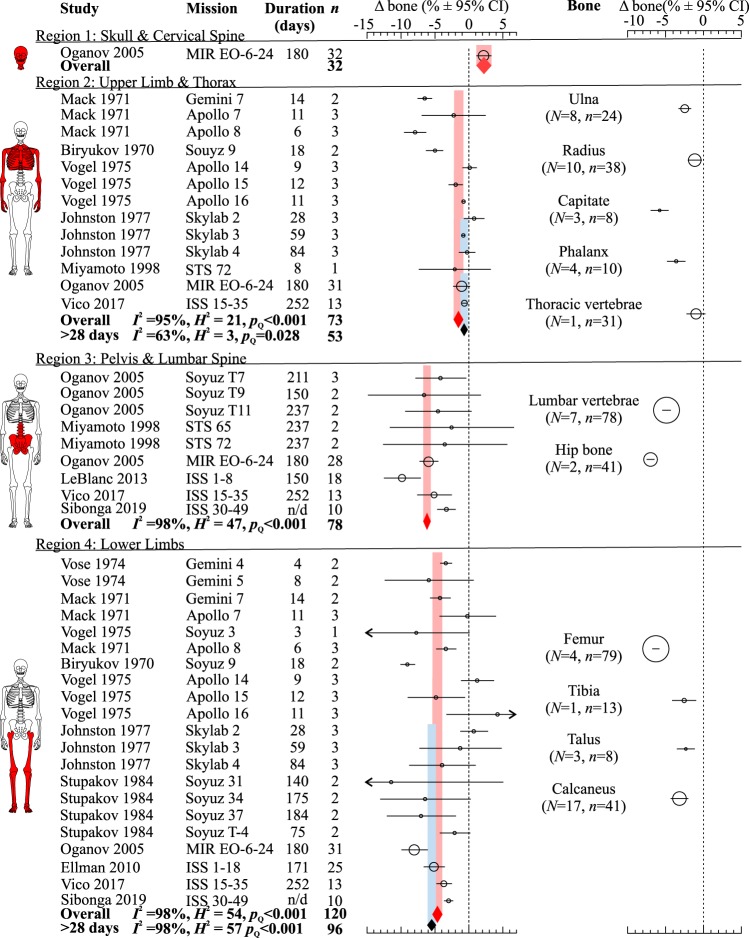
Fig. 2. Spaceflight-related bone density changes in different skeletal regions.
Forest plots of changes (Δ) in bone density (% of pre-flight) in the skull, cervical vertebrae (region 1); upper limbs, thoracic vertebrae, ribs (region 2); pelvis, lumbar vertebrae (region 3); and lower limbs (region 4) (left); and in individual bones (right). Circles/lines: effect sizes (marker sizes are proportional to number of astronauts) and 95% CI; red diamonds/bands: overall effects ± 95% CI; blue diamonds/bands: overall effects ± 95% CI for data from missions longer than 28 days. Dashed line: no change from pre-flight. N/d: not determined. Source papers are in mission order. Missions, their duration, number of missions/aggregated missions (N), and sample sizes (n) are shown.

