
Fig. 5. Post-flight changes in biochemical bone markers.
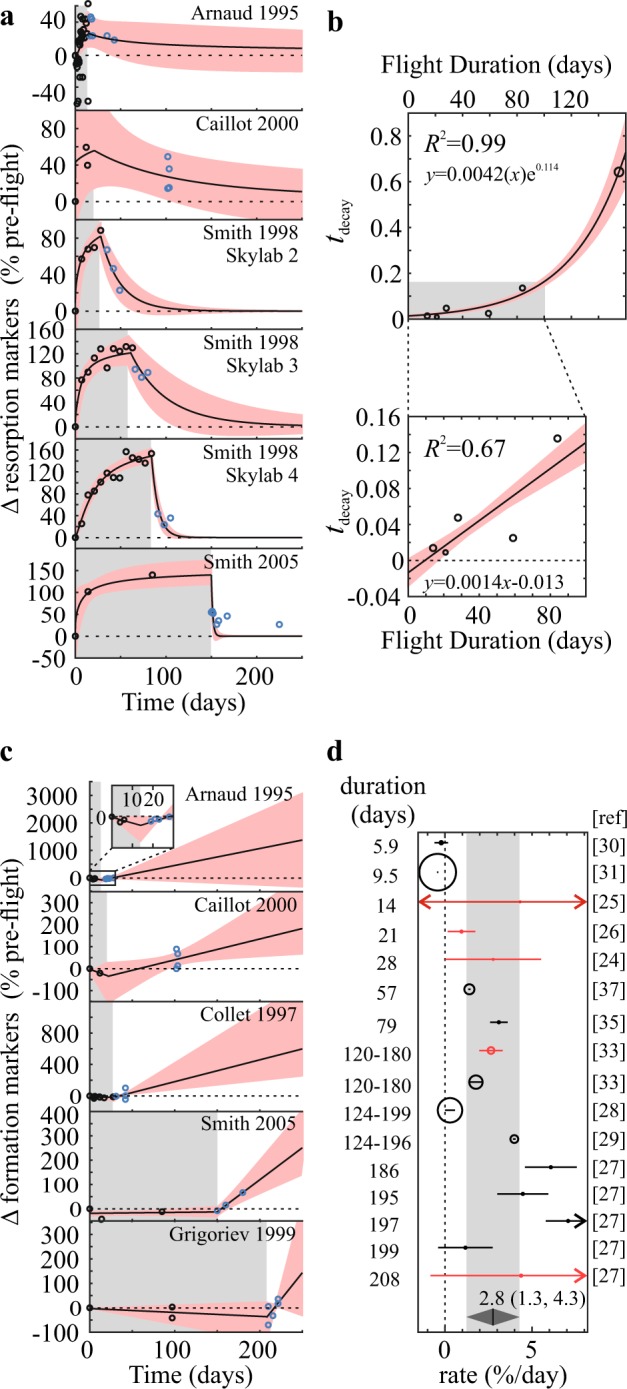
a, c Changes in markers of resorption (a) and formation (c) (% of pre-flight) were extracted from the studies that reported both in-flight and post-flight measurements and fit to a piece-wise function: a sigmoidal in-flight, exponential post-flight; c linear in-flight and post-flight. Black line/red band: mean fit/95% CI, studies are arranged in order of mission duration (gray background). b The effect of spaceflight duration on post-flight decay constant (τdecay) of resorption markers was modeled using exponential function for all flight durations (top) or linear function for mission durations <90 days (bottom). Black line/red band: mean fit/95% CI. d Forest plot of rates of post-flight changes in formation markers sorted by mission duration. Red circles: studies with in- and post-flight data, black circles—studies with only post-flight data. Gray diamond/band: overall estimate ± 95% CI.