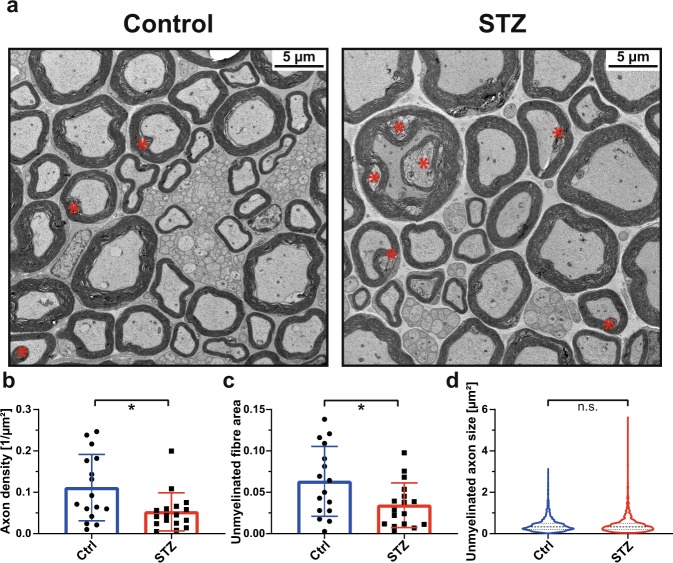
Figure 7.
Ultrastructural analysis of the sciatic nerves from STZ-diabetic mice. (a) Representative ultrastructural findings from control and STZ animals using electron microscopy (EM). Red asterisks indicate myelin infoldings. (b–d) Quantitative findings of the control (Ctrl) and the STZ groups comparing the three parameters (b) Unmyelinated ‘axon density’ (per image frame, n = 16 vs. 17 frames), (c) ‘Unmyelinated fibre area’ (i.e. the unmyelinated fibre fraction per image frame, n = 16 vs. 17 frames) and d) ‘Unmyelinated axon size’ (i.e. all unmyelinated fibres within the image frames considered, median and quartiles indicated, n = 1646 (Ctrl) vs. 878 (STZ)); *=p < 0.05, n.s. = nonsignificant, unpaired two-sided t-test.

