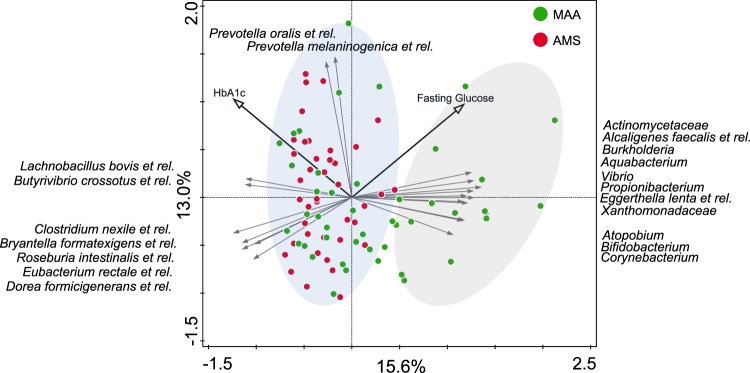
Figure 2.
Principle component analysis of the fecal microbiota composition of 85 overweight insulin resistant overweight males from Maastricht (MAA) and Amsterdam (AMS). Individuals from AMS and a subset from MAA overlap and a second group of individuals in MAA was observed as indicated by the right ellipse. These also show associations with the two metabolic parameters associated with microbiota composition in MAA through Random Forests analysis. The direction of the species arrows depicts the abundance of microbial groups. Length of the arrows is a measure of fit. The environmental variable arrows approximate the correlation between species and an environmental variable. The further a sample falls in the direction indicated by the arrow, the higher the correlation. Samples near the coordinate origin (zero point) suggest near zero correlation.

