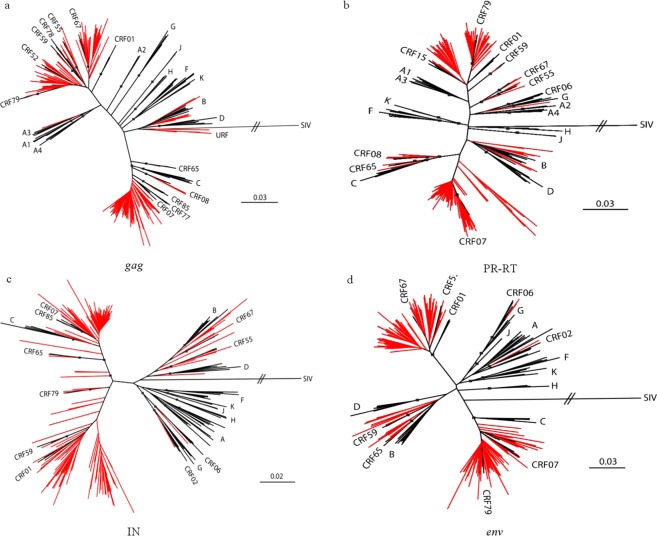
Figure 1.
Neighbor-joining phylogenetic tree analysis of HIV-1 isolates in blood donors. Sequences from HIV-1 infected blood donors and references are respectively in red and black in the trees and boxes indicate relevant nodes with >70 bootstrap. (a) Phylogenetic tree analysis of gag sequences. (b) Phylogenetic tree analysis of PR-RT sequences. (c) Phylogenetic tree analysis of IN sequences. (d) Phylogenetic tree analysis of env sequences.

