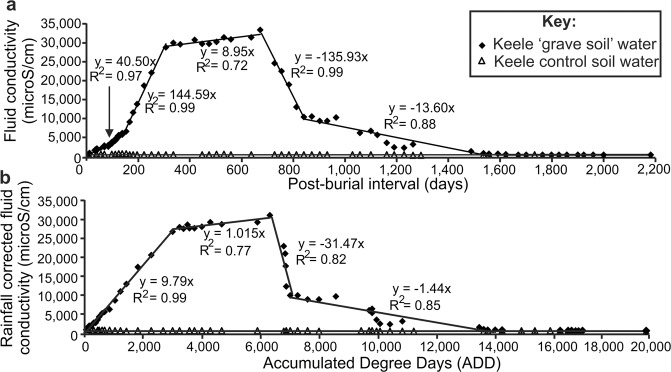
Figure 3.
(a) Measured ‘grave soil’ water (diamonds) and control soil water (triangles) fluid conductivity values for the 6-year survey period. (b) Measured soil-water conductivity versus accumulated degree day (ADD) plot produced from (a) by summing average daily 0.3 m bgl temperatures (see48). Best-fit linear correlation formulae and good fit R2 values also shown. Meteorological and conductivity data is provided in Supplementary data Tables S1 and S2 respectively. Modified from48.

