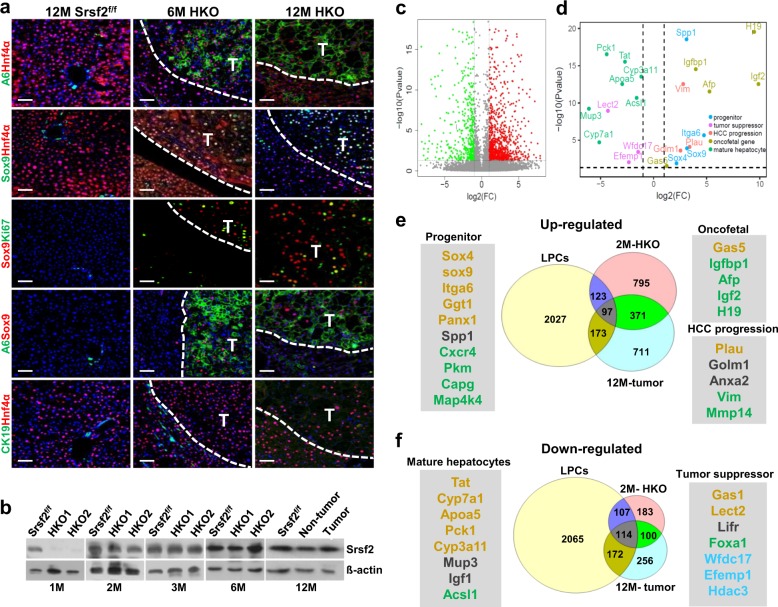
Fig. 6. Malignant tumors displayed both HPC and hepatocyte markers.
a Representative double-immunostaining with A6/Hnf4α, Sox9/Hnf4α, A6/Sox9, CK19/Hnf4α or Sox9/Ki67 in 6M, 12M HKO livers with tumors or 12M control livers (scale bars, 50 μm) (n = 3). b Srsf2 protein levels were detected by western blotting analysis at indicated ages of control and mutant livers. c Volcano plot showed up-regulated (red) and down-regulated (green) genes of tumors versus non-tumors of 12M mutant mice. Significance cutoff value was set at P = 0.05 in −log10 scale (horizontal dashed line) and fold change cutoffs at −1 and 1 in log2 scale (vertical dashed lines). d Volcano plot showed dots corresponding to up-regulated genes including progenitor markers (light-blue), oncofetal gene markers (brown) and HCC progression markers (pink), and down-regulated genes containing mature hepatocyte markers (green) and HCC suppressor markers (purple). e, f Comparison of differentially expressed genes among 12M tumors, 2M HKO livers and adult liver progenitor cells (LPCs).

