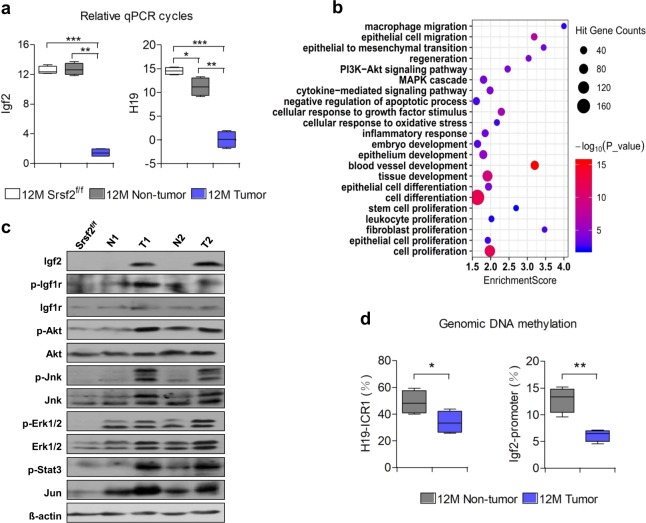
Fig. 7. High levels of Igf2/H19 and activated pathways in the tumors.
a Comparison of Igf2 and H19 mRNA levels in 12M Srsf2f/f, non-tumors or tumors of 12M mutant mice (n = 3). Note that qPCR cycles calculated as ΔCt values relative to the mean of β-actin. c Bubble diagram of potential pathways and biological processes based on Gene Ontology and KEGG analysis using the differentially expressed genes of 12M tumor versus non-tumors. d Igf2 and relevant pathways were activated in tumors of 12M mutant mice, addressed by western blotting analysis. Note that N for non-tumor and T for tumor; e Genomic CpG methylation ratios of H19 ICR1 and Igf2 P2 in 12M non-tumors and tumors (n = 3). *P < 0.05, **P < 0.01, and ***P < 0.001 vs. matched control by Student’s t test (b, d).

