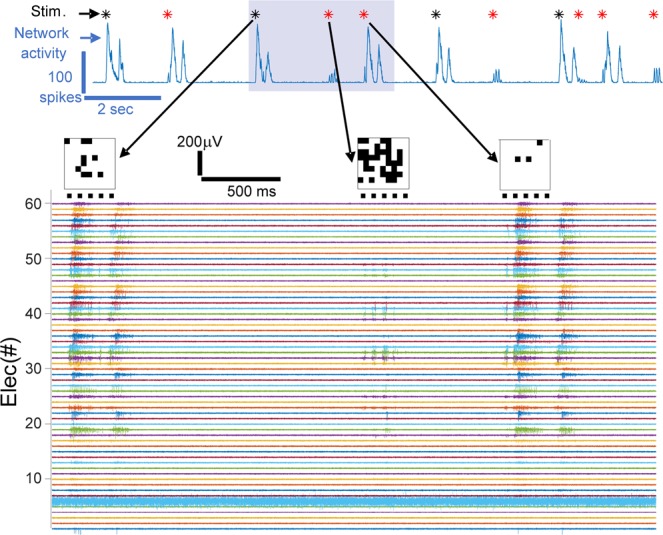
Figure 7.

Example of non-linear and linear responses of the BNN to the SNN stimuli. The BNN activity is shown on the top blue plot (total number of spikes recorded in time bins of 10 ms) where asterisks mark the stimulation times. In the case of linear (non-linear) network response the asterisk is red (black). Electrical recordings from all electrodes corresponding to the time window highlighted in gray are shown in the bottom plot. The three stimuli (matrix images) occurring in that time windows are shown on the top of the traces at the time of their occurrence, and the timing of the five pulses of blue light are marked as horizontal black lines under each stimulus-image. Note that in the case of the first stimulation, the response is a network burst and is considered non-linear (it is an overshooting response). The opposite, i.e. linear, case occurs with the second stimulus-image. In the case of the third stimulus-image, although the network respond initially with few spikes and later by generating a network burst, the response of the network in a bin of 90 ms falls within the linear regime.
