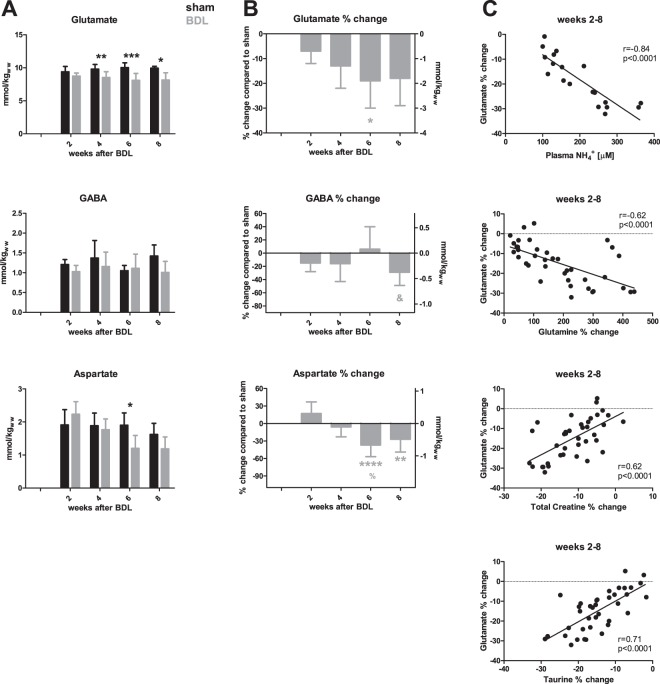
Figure 6.
Neurotransmitters and their correlations. (A) Changes in brain metabolite concentrations in sham (black) and bile duct ligated (BDL) (grey) rats throughout the study, in absolute concentrations. (B) % difference in metabolites between BDL rats and shams at each time point. Left y-axis: % change. Right y-axis: change in mmol/kgww (kg of wet weight). (C) Correlations of glutamate with blood and brain measurements. *Comparison between shams and BDL for each time-point; *(grey) significance compared to week 2; % indicates significance compared to week 4; & significance compared to week 6.

