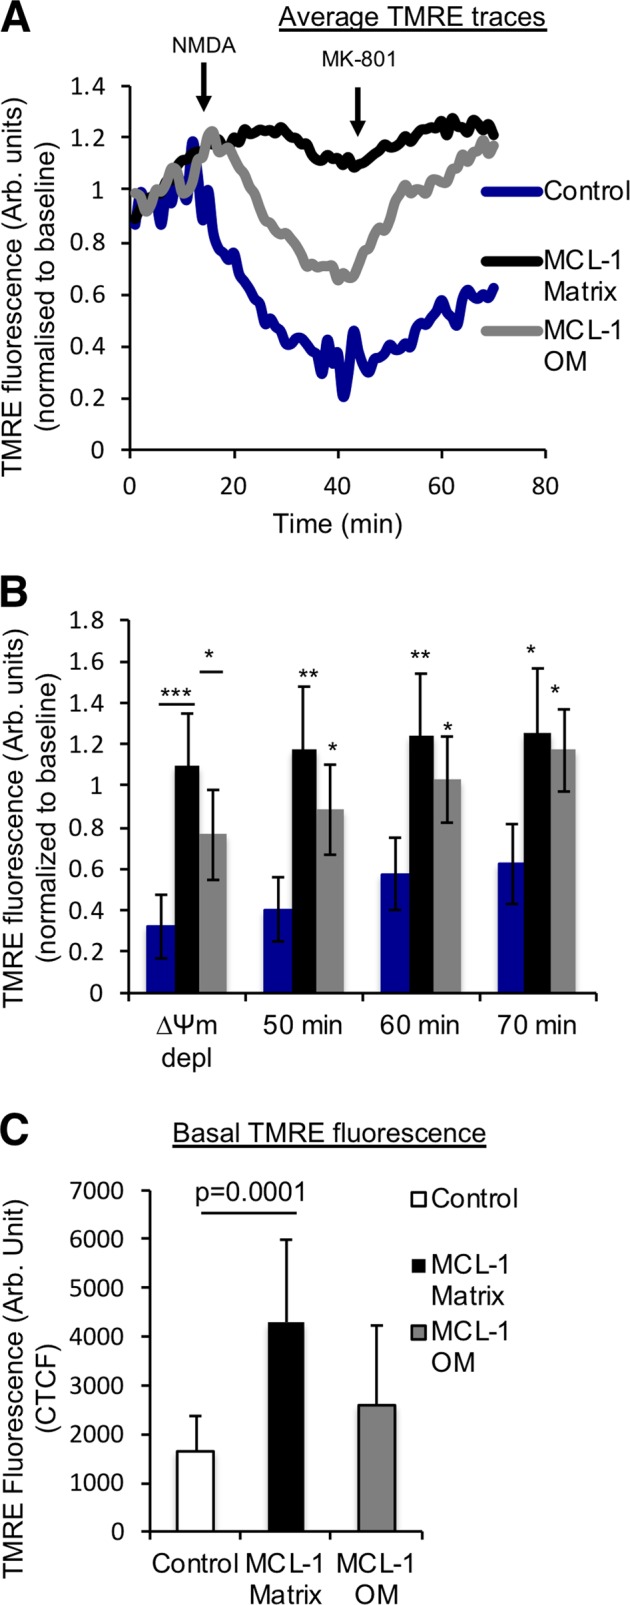
Fig. 2. MCL-1Matrix maintains mitochondrial membrane potential in response to acute neuronal stress.

a Average TMRE traces as in neurons transduced with lentivirus carrying Control, MCL-1Matrix and MCL-1OM during NMDA excitation. b Quantification of TMRE traces in (a) at the lowest value (∆Ψm depolarization) following NMDA excitation and at different time points as indicated. c Quantification of basal TMRE fluorescence in neurons expressing Control, MCL-1Matrix, and MCL-1OM (average ± SD of 12–14 neurons from two independent experiments). Data information: one-way ANOVA followed by Tukey’s post hoc test. *P < 0.05, **P < 0.01 and ***P < 0.001.
