Figure 4.

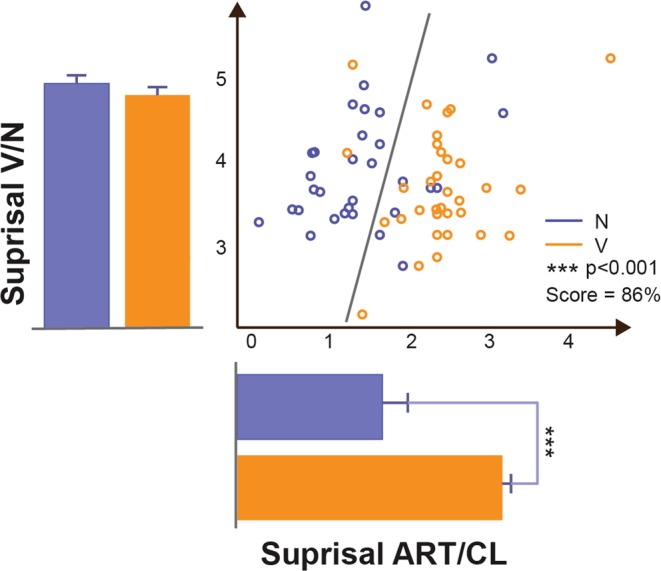
Example of event-related spectral perturbation and decoding for a responsive contact (channel). The first row represents the Event-Related Spectral Perturbation (ERSP) for VPs (left) and NPs (right) respectively. The four vertical lines respectively represent the beginning of the phrase, the beginning of the Art/Cl (homophonous phrase), the beginning of the first word after Art/Cl (i.e., Verb/Noun), the beginning of the word after that. The high gamma time Region of Interest (tROI) is highlighted by a superimposed square over the ERSP plots. The second row shows the baseline-normalized power in the [150–300] Hz spectrum interval. The four vertical bars have the same meaning as in the ERSP plots. The third row shows on the left a comparison between the VP tROI (orange) and NP tROI (blue) high gamma power. Similarly, the scatter plot on the right represents the tROI normalized power (y axis) and surprisal (x axis). The gray line optimally separates (Support Vector Machine analysis) the Verb and Noun classes in the surprisal/power feature space with a Score of 83%.
