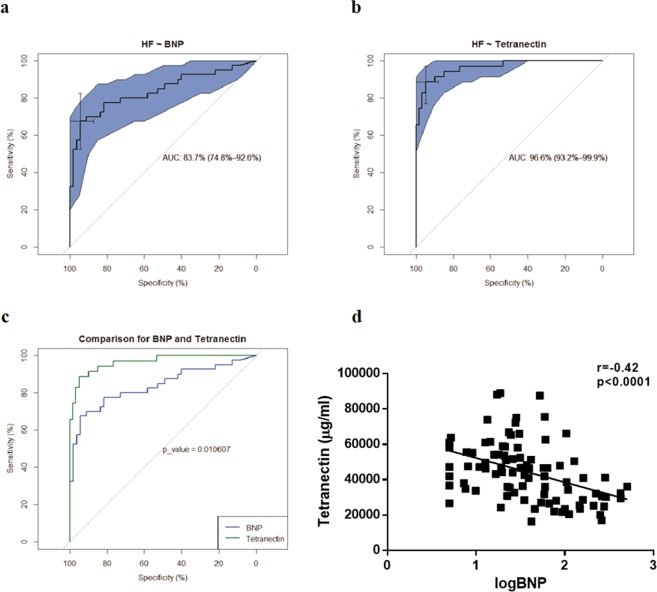
Figure 2.
ROC curves for Tetranectin (a), BNP (b), and a comparison of Tetranectin and BNP (c) differentiating between patients without and with HF (study cohort 1, n = 100). Circulating Tetranectin and BNP were measured using ELISA and Triage Meter Point of care assay, respectively. Specificity and sensitivity thresholds, and area under the curve (AUC) with 95% Confidence Intervals presented. Correlation between Tetranectin and BNP is highlighted (d). Correlation coefficient was assessed using Pearson method.

