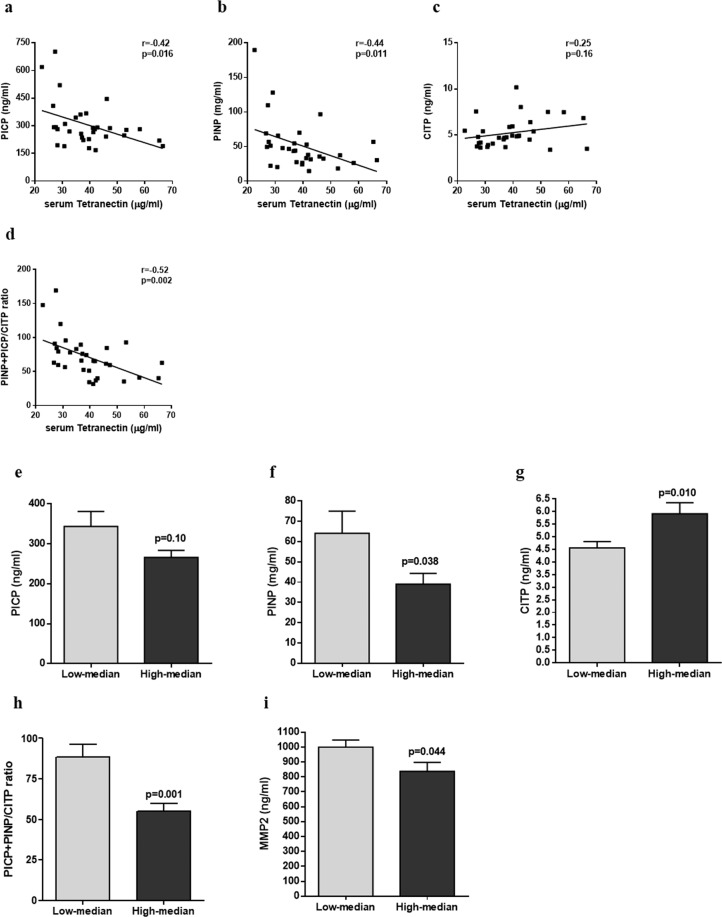
Figure 3.
The relationship between serum Tetranectin levels with circulating markers of fibrosis – PICP (a), PINP (b), CITP (c), and PINP + PICP/CITP ratio (d), were assessed using correlations and Pearson or Spearman correlation coefficients; and by stratifying the patient population based on the median serum Tetranectin levels, PICP (e), PINP (f), CITP (g), and PINP + PICP/CITP ratio (h), and MMP2 (i). Circulating fibrosis markers were quantified using ELISA and radioimmunoassy. Cohort size, n = 32. Data represent mean ± SD and analysis performed using independent t-test or Mann-Whitney test.

