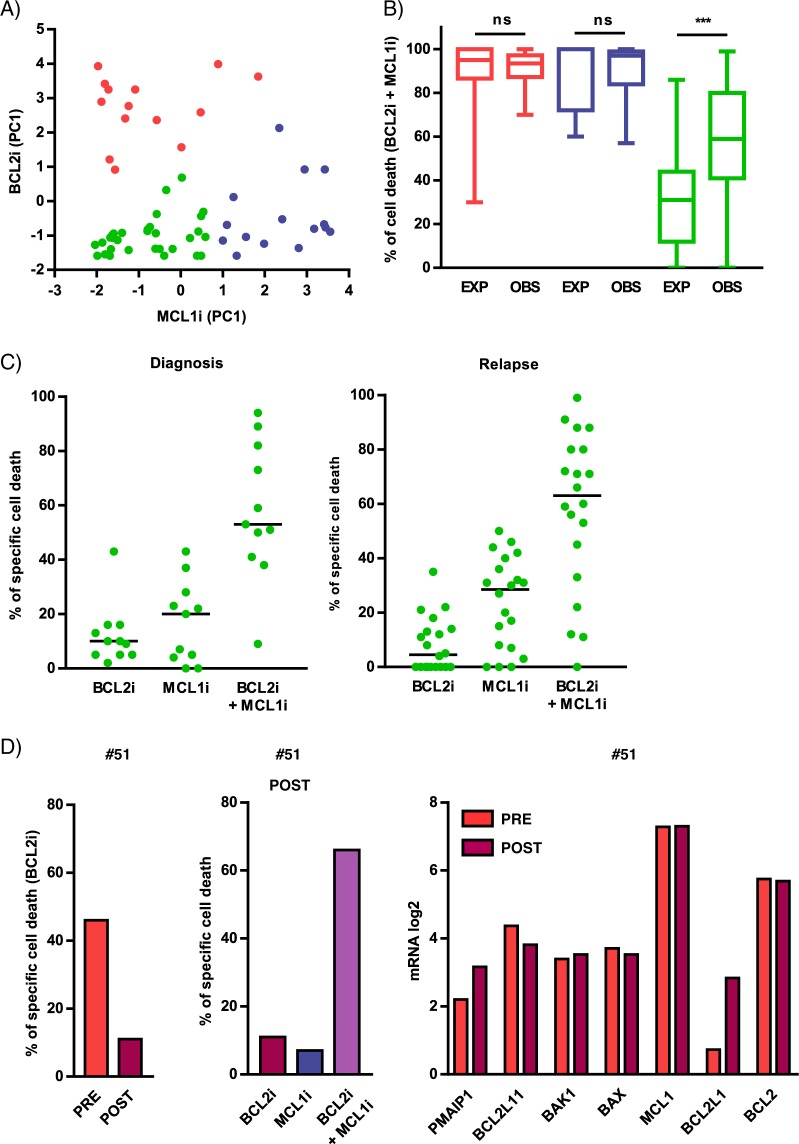
Fig. 2. The combination of BCL2 and MCL1 inhibitors is efficient in a majority of primary cells resistant/poorly sensitive to each single inhibitor.
a Novel unbiased cell death clustering by k-means in 60 patient’s samples combining cell death induced by S63845 (12.5, 25, and 50 nM) and venetoclax (100, 300, and 1000 nM) as single agents (n = 1000 initiations of algorithm). Three clusters of patient’s samples have been defined and corresponded to poorly sensitive/resistant to both venetoclax and S63845 (green, n = 31), venetoclax sensitive (red, n = 14) and S63845 sensitive (blue, n = 15). Data are represented according to each sample principal component (PC1) values for venetoclax and S63845 sensitivity. b Analysis of the sum of cell death induced by MCL1 + BCL2 inhibitors (expected) compared to cell death observed with the MCL1 and BCL2 inhibitors combination in the three clusters of patients. Values of MCL1 and BCL2 inhibitor combination are indicated Table 1. Statistical analysis was done using Wilcoxon test. c Cell death induced by MCL1 and BCL2 inhibitors combination in poorly sensitive/resistant MM patient samples (green cluster). Cell death induced by MCL1 inhibitor, BCL2 inhibitor and their combination in patient’s samples at diagnosis (n = 11) and relapse (n = 20). Optimal cell death threshold was set at 50%. d Analysis of primary MM cells from patient #51 before (PRE) and after (POST) venetoclax treatment. Left panel: comparison of ex vivo venetoclax (300 nM) sensitivity before (PRE) and after (POST) venetoclax treatment. Middle panel: Analysis of ex vivo venetoclax (300 nM), S63845 (25 nM) and venetoclax/S63845 combination sensitivity after venetoclax treatment. Right panel: comparison of BCL2 family expression analyzed by DGE-RNA seq sensitivity before (PRE) and after (POST) venetoclax treatment.

