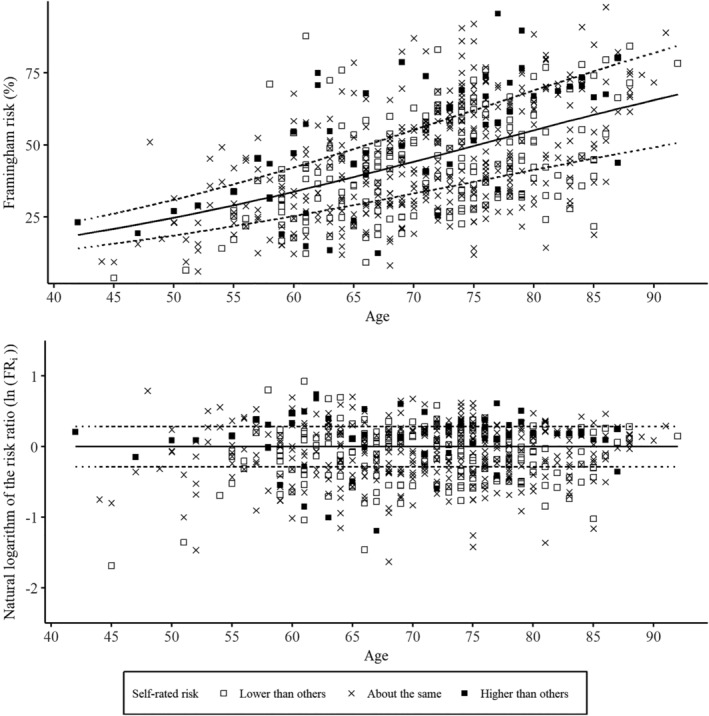
FIGURE 2.

Distribution of calculated Framingham risks and cut‐offs for UO and unrealistic comparative pessimism (UP). The upper part of the Figure shows the calculated Framingham risk (F i) plotted for every individual. The solid line represents the mean risk prediction dependent on age (FP i). The dotted lines show the nonlogarithmic cut‐offs for the risk ratio (FR i) between F i and FP i. The lower part of the Figure shows the natural logarithm of the risk ratio (ln(FR i)) for every individual. The solid line represents no difference (ln(1)) and the dotted lines represent the cut‐offs for ln(FR i), that is, below average (ln(0.75)) and above average (ln(1.33))
