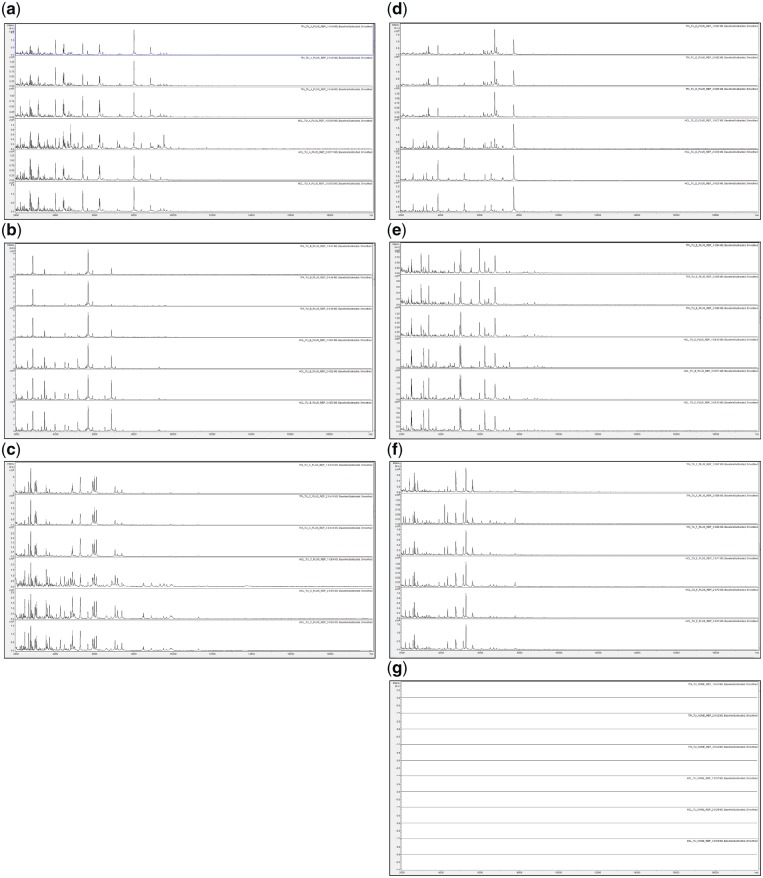
Figure 1:
MALDI-TOF MS spectra of acid-soluble proteins for, from top to bottom in each panel, TFA-based extraction (replicates 1–3) and HCl-based extraction (replicates 1–3) for (a) P. ananatis (+), (b) C. citreum (+), (c) S. maltophilia (+), (d) B. glumae (+), (e) R. radiobacter (+), (f) P. humilis (+), and (g) negative control.

