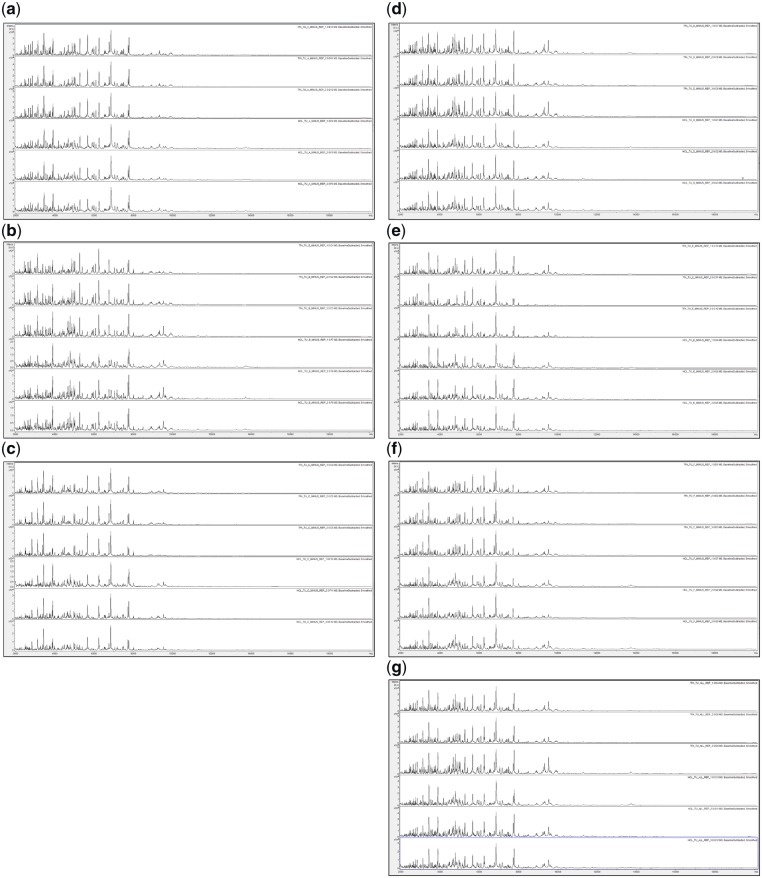
Figure 2:
MALDI-TOF MS spectra of acid-soluble proteins for, from top to bottom in each panel, TFA-based extraction (replicates 1–3) and HCl-based extraction (replicates 1–3) for (a) P. ananatis (–), (b) C. citreum (–), (c) S. maltophilia (–), (d) B. glumae (–), (e) R. radiobacter (–), (f) P. humilis (–), and (g) All (+).

